Fish Bone Diagram | Cause & Effect Diagram | Ishikawa Diagram | MBBMohitSharma

Вставка
- Опубліковано 19 сер 2024
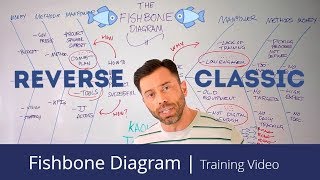
- This video will help you to know what is a Fish Bone diagram and how can you easily use it for Manufacturing and Services Industry.
If you find this video useful, don't forget to subscribe to my channel and show your interest by hitting the like button. Share it with you friends who can benefit from this.
Thanks for all your support.
Do drop in your comments and connect with me on other social media too.
Read My Book 8 Steps to Problem Solving for easy and concise explanation of LSS topics with the help of case studies.
Disclaimer... All this content is copyrighted. Please do not use any content without my permission.
Visit my website mbbmohitsharma.com
You can checkout my First Six Sigma book, 8 Steps to Problem Solving. It is available at all leading stores online. Links are mentioned below for your ease.
Flipkart
www.flipkart.c...
Amazon
www.amazon.in/...
Shopclues
www.shopclues.c...
Smashwords
www.smashwords...
You can connect with me on Twitter, Linked In and Quora.com
Linked in / feed
Quora www.quora.com/...
Twitter / mohitsharma1904
Website mbbmohitsharma....
Filmora Wondershare Video Editor is used for editing.


![Дон ДОН, Алаудинов и СБЕЖАВШИЕ из под Курска ахматовцы 😁 [Пародия]](http://i.ytimg.com/vi/dEfCf5IK26Q/mqdefault.jpg)


Fish bone diagram....Great video sir.
Dilshad Khan thanks 🙏
Very good video. Even in the robotics and AI era lean six sigma is still the go-to method for solving business problems.
Harvey Brown that’s right ! Thanks 🙏
Very informative video...And easy to understand.
Bharat Kanodia much thanks 🙏
Awesome 👏
Easily understandable !
Bhawna k thanks 🙏
Explained in a clear way with simple examples...Thank you.
Started listening to your sessions along with my regular sessions sir....the way of communicating with simple examples gives us to grasp the content easy to understand.
thanks sir..!!
please sir make video on pareto analysis(ABC )
There are so many videos on Pareto on my channel
Sir can you also explain the PPPPE if it is possible
People process procedure place & environment
Root cause analysis please send it
Sir, Can you pls suggest how to plot C&E diagram in minitab
Yes sure will do that.
Practical work?
Check my other videos for practical application
Not possible to explain slowly??...