Vegetation Experiments

Вставка
- Опубліковано 16 вер 2024
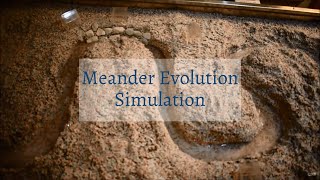
- These experiments were performed by Little River Research & Design in our Em3 geomodel. They explore the effects of riparian and shoreline vegetation during floods. You can read more about riparian buffers and their benefits on our blog at emriver.com/blog/.
The first experiment uses our K500 Digital Flow Controller, which has built-in hydrographs. This experiment uses the ‘Megaflood’ hydrograph. Floods occurred 30 minutes apart, and the flow rate between floods was 50 ml/s. We can quickly see the effects of the vegetation as the downstream non-vegetated cut bank is eroded at a much faster rate. By the end, the downstream portion of the river has considerably changed its path, while the vegetated portion has remained stabilized.
The second experiment uses our Wave Maker. Delay between waves was 1 second, and paddle speed was 80%. Three and a half gallons of water were added 60 minutes in to represent a rising tide. This happens at approximately 1:27 for the non-vegetated beach, and 1:30 for the vegetated beach. We can see the beach with the mangrove forest lasts much longer, and even after a higher tide the water does not flood the neighborhood as it does on the non-vegetated beach.
If you enjoy this video please like and subscribe.
Don't forget to click the bell so you get notifications when we upload new videos and live stream.
For more information about our Emriver models and modeling media, visit our website at: emriver.com
Find us on:
Facebook - / littleriverusa
Twitter - / emrivermodel
LinkedIn - / little-river-research-...
Instagram - / emrivermodel