Partial derivatives and graphs

Вставка
- Опубліковано 10 тра 2016
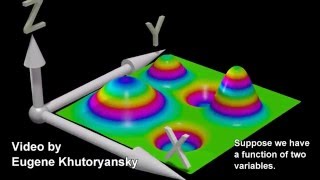
- One of the best ways to think about partial derivatives is by slicing the graph of a multivariable function.
About Khan Academy: Khan Academy offers practice exercises, instructional videos, and a personalized learning dashboard that empower learners to study at their own pace in and outside of the classroom. We tackle math, science, computer programming, history, art history, economics, and more. Our math missions guide learners from kindergarten to calculus using state-of-the-art, adaptive technology that identifies strengths and learning gaps. We've also partnered with institutions like NASA, The Museum of Modern Art, The California Academy of Sciences, and MIT to offer specialized content.
For free. For everyone. Forever. #YouCanLearnAnything
Subscribe to KhanAcademy: ua-cam.com/users/subscription_...


1:55 the thing my toilet sees everyday
Oh man ,u see things differently
Which normal persons can't visualize
What software do you use for writing notes and slicing graphs?
This is art.
Can't even think of a better way of explaining this. Thank you!
Great video, my only little remark is that the way you write your twos makes them look a lot like a z, which would be fine in the single variable world, but since we are working with functions in three dimensions, it could be confusing for some people.
If someone thinks that is a Z in this context then lmfao
These videos make me happy to learn! ^_^
Good to hear! Me too.
You made my last 10 years man...
No word to thank you...
❤️❤️❤️❤️❤️❤️❤️❤️❤️
I have been struggling with this for a long time and in 2 videos you make it so clear and understood thank you so much
This man is the Bob Ross of math!
Love the explanation and the graphics.
thank you.. i had the intuition that the partial derivatives would form 'slices' of the surface to form curves, i just had such trouble visualizing it in my mind.. i also did not realize to form these slices you just have to pick a constant value for y, as you increment the constant value you can start to visualize the gradient of the function..
Thanks so much! This helped!
What a great explanation.
Thank u for making it so simple
Perfect explanation
Thank you!
Super cool video!
Thank you so much
Wow!! What an amazing explanation...!!!Gr8👍👍👍👍👍👍👍👍👍👍👍👍👍👏👏👏👏👏🏻👏🏻👏🏻👏🏻👏🏻👏🏻👏🏻👏🏻👏🏻👏🏻👏🏻👏🏻👏🏻👏🏻👏🏻👏🏻👏🏻
Beautiful!!!!❤️❤️
before watching this video i had never seen a graph in such a way
Great job 👍👏🎉
Is this 3blue1brown?
So the partial derivative only shows a change in Z because x or y,
(depending on whose partial derivative you take) will be constant?
You are awesome!♥️♥️♥️♥️🙏🙌🙌🙌🙌
Awesome
Love the graph "slicing" ! 😂 🎉
you could have used small angle approx to denote the trig values
Very good editor you use there. I don't believe it is SmoothDraw 4? What program is this?
Can i say,wow!what a great job!
What about when you want to know what the shape is doing in a partial step in the x direction and a partial step in the y direction?
Really best videos
Great♥
good explanation
graphs are the best
Good video
My mind was blown when I got to know that this is 3blue1brown
Beautiful!!
Why we are interested in 2 specific derivatives in specific directions (along the x and y axes) when we can ask about the derivative of other infinite directions? is it because it is easier to calculate? how can we calculate the derivative of other directions?
The different directions would be different parametrisations of the same graph, but lead to a different function.
It is easier to calculate in x and y directions as usually we are in euclidean space. We can surely calculate the derivative in any direction we want, for example by using polar coordinates here the parameters would be the angle theta and the radial direction in which we want to calculate, this is particularly useful when there is spherical symmetry, but it is really tedious
what software did u use?
Thanks I did understand d concept. But how did u locate tat point(-1,1) to on graph?
same question for me
and what does fxx and fxy mean in geometry?
does anyone know what program they are using to draw? it doesnt look like the usual smoothdraw
its the grapher
How to evaluate the derivative in any direction but not in direction of x or y axis
directtional dedriative
Thank you! Does anyone know what is this program? it looks really useful..
It’s called Grapher and its a default program on Mac computers made by apple
@@ijarbis187 No, its manim. An open source python library
The first graph in the video is like man body upside down
what is the name of the program used in 3d drawing ?
Interesting. I like to know too. I don't believe this is Smoothdraw 4.
Mac Grapher
But it's Grant Sanderson of 3Blue1Brown! Isn't it?
Yes it is.
You sound like timothy sykes
But sel Khan is best all the time ..
4:46
x youre a constant!
why?
youre the variable!
isnt this 2 variable input and 2 variable output? why does he call it 2 variable input and 1 variable output?
why is f(x,y) in 3D?
Sai Meghana f(x,y) isn't actually in 3d.
The point is the inputs are ordered pairs(as opposed to usual functions from |R->|R)
So the "graph" is made like this considering the input domain to be the whole of |R^2
f(x,y) is in three dimensions, if we graph it the standard way. Two dimensions for input (x,y) and a third dimension z where z = f(x,y) for output.
What doesn't make sense is if you use a pure graphical interpretation. What is stopping you from looking at the slope from the other direction and thinking what should be positive is actually negative?
Can you please tell me the plotting software used
It’s called grapher and its a default program on Mac computers made by apple and its only on Mac I’m pretty sure. It’s amazing I use it all the time.
@@ijarbis187 Its manim. He makes the program himself
shouldn't the point (-1,1) be parallel to the (x,y) surface?
I have to do this shit in uni? Fuuuck
it's actually pretty interesting.
What you mean? There's alot of money involved in machine learning? Doesn't it reduce human labour?
Alpha Beta nah , people who work on machine learning gets more money , people who work for learned machines gets less money.
LOVE YOU WHOEVER DISLIKED THIS MUST BE BLIND
Oh 3b1b.
I thought so
maaaaaaan
I guess, Mr Grant Sanderson speaking 🙄
second !!
why is this a 3D graph? shouldn't it be 2D?
f(x,y) is a 3D graph because x and y are the input and f(x,y) is the output.
I personally don’t believe in god but when I think of a person who does deeds Jesus would do i would think of grant
oversimplified
how would you explain it?