Making a Bell Curve and Assessing Normalcy in Google Sheets - Statistics Tutorials

Вставка
- Опубліковано 7 бер 2021
- When you're learning about density curves, Normal distributions, and bell curves in statistics, it can be frustrating to realize that Google Sheets doesn't offer an easy, ready-made option for making density curves. This tutorial video will show you how to "trick" Sheets into making a perfect bell curve. It includes:
1. "Normalizing" your data - that is, figuring out what the relative frequencies in your data set would look like, IF that data set were a perfect Normal distribution.
2. Creating a density curve graph to show that Normalized distribution as a perfect bell curve.
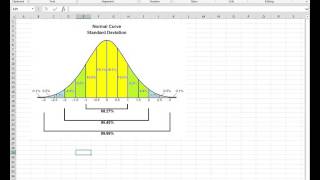
3. Comparing that perfect Normalized distribution to the actual data set to see how well it actually fits, using two different methods: visual comparison, with graphs, and numerical comparisons with the Empirical Rule (a.k.a. the "68-95-99.7 Rule.")
This video is especially aimed at helping any of my Statistics students who are having trouble with our Unit 2 project, "What is Normal?"