Doing More with Tables & Matrix Visuals in Microsoft Power BI

Вставка
- Опубліковано 21 сер 2024
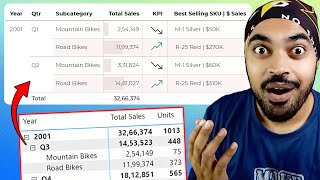
- Sick of building tables and matrices for your Power BI reports only to find out no one's looking at them? Depending on the complexity of your table/matrix, your users may be suffering from "number fatigue", but fortunately there are tons of tricks you can employ to design a table or matrix that users can process almost instantly!


So much better than plain old tables and matrices! Thanks Sean.
Your channel is so underrated, you helped me alot specially in the movies database videos. Many many thanks.
I love such experiments with visuals. Love your work.
Sean! This is amazing work and thank you for putting your time and effort to bring this to us!!
Thank you brother!!
really helpful
Great vid, thankyou! Helpfully Microsoft has removed the ability to change the name for columns and rows to just be a space. Do you know of any way to get this?
Gold
Hi this is great and very insightful, also where can we download this UFO sighting dataset?
Can i get the raw data?