How To... Perform Logarithmic Regression in Excel

Вставка
- Опубліковано 22 лип 2024
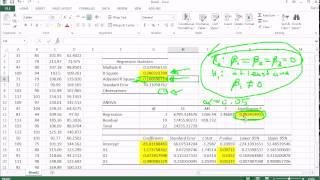
- Use Excel to create a logarithmic regression model to predict the value of a dependent variable based on an independent variable. In this video you will visualise the data and create a model that can be used to make predictions. The data used in this example is based on tree growth.


Thank you for a refresher of 30 years.
I've been trying to find a way to do this for SO LONg, THANK YOU SO MUCH
Extremely helpful! Thanks so much!
fantastic- just what we needed!
Thank you so much. Extremely helpful.
Thank you sir for your very simple yet effective informative video
you just saved my life. Thanks very much.
Thank you, this was tremendously helpful
How would one find the optimal co-efficient and constant by hand?
Thanks so much!!! Helped heaps 👏👏
Muchas Gracias por el vídeo, estudiando desde casa.
Very helpful sir. thankyou so much!
thanks, thats what I needed! :)
This Guy a GOD at maths
It's fantastic, it's helped me forecast sales! Thanks a million!
I’d be really concerned if your sales plot to a logarithmic curve
@@elmukelmu123 Why would they?
@@Walter.Quiroz Did your forecast come true!?
@@dartme18 Pandemic wouldn't help, it was quite close to the adjustment though.
fantastic sir. Bless you.
Top, thanks sir!
Which excel version is this?
Thank you!
Fantastic overview. Thank you
Glad you liked it!
Mega vid, used it to create a voltage curve for the oil temp
Thank you Sir. I have a question, what about to search x what the formula will be if y=50 ? And what the formula to enter on excel ? Help me please
thanks, now I get it
Can anyone tell me how to get the number b&a (y=blogX+a) automatically without typing. I normally use intercept function but it works with linear and polynomial equation only. HELP PLEASE!
As explicit as it could get. Thanks
awesome
Tx sir
how can we find x if y would be given
Did you ever find out?
@@Melissa-ds1te yes
@@manojtomar8026, Can you please share how you did it? I appreciate that.
Hello, Sir. I am a resercher from India. My question is about Duncan's Multiple Range Test. We are generally performing this test using either spss or MS excel patch. But how to calculate it manually from ANOVA table? Please make a video.
Please upload how to solve, y=a+bx+c logx
Did you solve it? can you please share how you did it!