Dynamic Zone Visibility - Full Dashboard Tutorial with instructions

Вставка
- Опубліковано 22 лип 2024
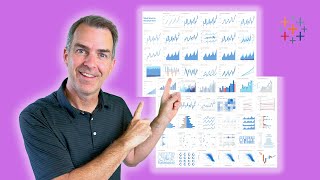
- Dynamic Zone Visibility (DZV) is a real game changer for creating more customised and personalised dashboards in Tableau. This video walks through how I created a dashboard with five dynamic containers, each containing charts relevant to a particular analysis scenario. See below for more information and instructions.
📊 Visualisations
DZV Dashboard: bit.ly/3P932QI
📑 Blog post
DZV Overview: datavis.blog/2022/10/31/table...
DZV Dashboard: datavis.blog/2022/11/30/table...
📌 Chapters
00:00 - Intro
00:18 - Adding scenario containers to the dashboard
01:40 - Apply DZV calculation to first container
03:40 - Dynamic titles within a container
05:10 - Dynamic charts within a container
06:15 - Step through all five scenarios showing which calculation is True or False
06:55 - Show (or edit) calculations directly from the dashboard
08:12 - DZV Scenario calculations
12:22 - How to use ‘Allow selection by category’ from the tooltip
14:00 - Dashboard set, filter and parameter actions
▶ Subscribe for the latest tips and tutorials: bit.ly/TableauTutorials
🔗 Social Media
Blog: datavis.blog ➝ Tableau tips and tutorials
Twitter: / datavisblog ➝ Follow for new blog & video posts
Portfolio: public.tableau.com/app/profil...
LinkedIn: / marcreiduk


Refreshing ! Now, I will go blow some minds.👍
Great video, thank you!🙂
You're welcome!
This is such a fantastic tutorial. Great use case and demo of dynamic zone visibility, and also excellent tips on using sets and set actions, parameter actions, dynamic titles, etc. etc. I'll be recommending this to my TUG members and anyone wanting to learn more about DZV. Thanks Marc!
Thanks a lot, Jen. That's much appreciated and I'm glad it was helpful. All the best!
Thank you Marc for this video. It's the best about DZV I've watched. Thank you also for the numerous tips scattered across the video. I've learned a lot despite the fact that I'm using Tableau for several years now 🙂
Hey Alain, thanks for the comment! Great to hear it was useful.
p̾r̾o̾m̾o̾s̾m̾ 💃