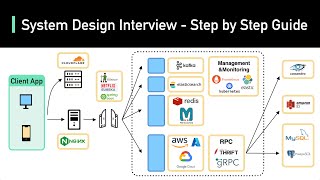
Data Pipeline Overview

Вставка
- Опубліковано 5 лют 2025
- Get our 158-page System Design PDF for free by subscribing to our weekly newsletter: bit.ly/bytebyt...
Animation tools: Adobe Illustrator and After Effects.
Checkout our bestselling System Design Interview books:
Volume 1: amzn.to/3Ou7gkd
Volume 2: amzn.to/3HqGozy
The digital version of System Design Interview books: bit.ly/3mlDSk9
ABOUT US:
Covering topics and trends in large-scale system design, from the authors of the best-selling System Design Interview series. - Наука та технологія


First creator whose reels give clear picture of the topic.
True
can we get a full video about this please
no
ua-cam.com/video/kGT4PcTEPP8/v-deo.htmlsi=d9p035lvnSYv3fYG
No
Just read Designing Data Intensive Applications
Maybe a short about MapReducs / Hadoop could be cool.
Yes please
That's no longer used buddy
@@ingenieroriquelmecagardomo4067 what's its alternative rn?
@@maddriven07 Apache Spark / Databricks
There are many, Flink, Spark, BigQuery, Snowflake, etc@@maddriven07
Full blown course please
ua-cam.com/video/kGT4PcTEPP8/v-deo.htmlsi=d9p035lvnSYv3fYG
Hi, Could you tell me about the flow chart tool used in the video, or how to make this kind of flow chart, thank you very much😊
Did you get a tool which he is used for... Even I want to know that
I am looking for the same answer too
What tools do you use to design the diagrams plz ?
Looks like adobe(photoshop and illustrator)
Animation tools: Adobe Illustrator and After Effects.
woww this is excellent video to explain ETL activities in each phase.Thank you.Subscribing.
This is golden. Thank you! Would you be open to share/create a powerpoint slide with these steps and the diagrams?
Thanks subtitles you made me got it
really cool way of teaching
This is amazing and very helpful. Thank you!
Full breakdown amazing 🙏🏽💯
Pipeline data Workflow. Great insight
So the last two steps are both Compute?
They involve compute yes, but this whole process involves computation. The migration of data from one store to another requires compute
The last one especially requires more compute if you’re using machine learning models to find insights
Full course would be big opportunity
on which tool this infographic is designed?
@@chaitanyamuttanapalli3264 good question
Great video! what software do you use for the visual graphics?
Msft power bi, tableu are the most famous ones
Great work, How do we draw these diagrams?
What software did you use to animate the video
Can you throw light on File based sources common data ingestion process using Hadoop
Thanks, It's useful for me.
Do you have books you recommend on this topic? Thank you
keep it up a ghassen
Which tool have you used to create the presentation
I am learning product management, and feature testing before full rollout is important to us. However, how do organization track "clicks" across their entire interface in such a high traffic environment?
Hi do you do training on tech ?
How did you do this kind of diagram ?
Great video, may i know which tool you have used to demonstrate the process pipeline here …
UA-cam itself is a database and we are the data
Why two “compute”? Maybe it’s “visualization”😮
May i know the software been used here to generate the flow diagram?
Where did you worked?
Thanks You!
Does this change for AI use cases ?
send link
🎉
IS YOUR EYES NEVER BLINK? 😮😅
who is this guy
thats more for fortune 500 companies hehe
this is psychotic
✊🏾✔️📠
Stop calling it data processing. It's just biasing and outdating
pls explain
\o/
Super insightful, but dog are you a real person or AI? Like why do you move like that? Why don’t you blink?
dint notice that before reading your comment. need to apply a AI model to find if its a real human or not :D
this is all buzzzword soup