How to Graph y = x^2 + 3 (using a table of values)

Вставка
- Опубліковано 21 жов 2024
- In this video we'll draw the graph for y = x^3 + 1 .
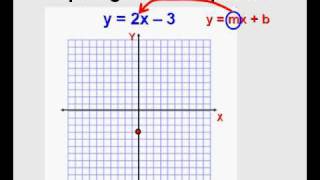
First, we will use a table of values to plot points on the graph. Once we have two or three points, we can draw our line for the linear equation. You can choose any values of x for your table, however, 0, 1, and -1 are often best since they result in point that will fit on your graph paper. This is likely the easiest way to graph the equation y = x^3 + 1 when you are starting to learn to graph.
Note that the graph is a parabola. If we were to graph y = x^2 it would be a parabola with the vertex at the origin (0,0). For x + 3 we just move that parabola up three on the y axis.