A compelling Excel chart for Actual vs Budget, Target and Last Year (Cantonese VO)

Вставка
- Опубліковано 21 сер 2024
- For video with English VO, please visit: • A compelling #Excel ch...
or Turn on CC for English subtitle.
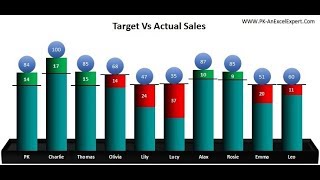
In business world, we often compare actual sales to various benchmarks such as budget, target, and last year. In this video, I am going to show you step-by-step how to make a compelling chart for this purpose. This is basically a simplified version of bullet chart, and is super-easy to create. I hope you find it useful and relevant.
Blogpost:
wmfexcel.com/2...
where you can download a sample file to follow along.
I hope you like this video. If you do, please give a thumb up, share and subscribe. :)


Excellent solution for a confusing chart. Congrats on your second video!
Subscribed!
Excel On Fire thanks so much for your support!
Thank You !!
Automation Guide Welcome! Thanks for watching.
I have an better chart idea to show target, actual, shortfall and over achieve
Mind sharing?
Can we do this in pivot table?
What if we have salesmen and we want to show numbers like this table?
Hi Sam, you can create a chart like this for sales person/product/geographic locations....... just follow the data layout and put all data accordingly. Nevertheless Pivot chart does not support customization like that......