Confidence Interval Chart in R (Independent Means & CIs)

Вставка
- Опубліковано 6 вер 2024
- Part 2 of this video is here: • (Part 2) Confidence In...
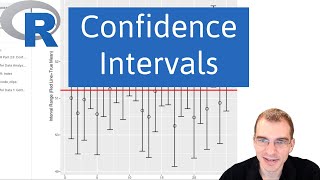
I demonstrate how to create an error-bar chart with 95% confidence intervals for independent means (independent t-test; one-way between-subjects ANOVA) on the basis of a set of two R functions originally created by Thom Baguley.
You can download the function file I used in this video here:
sites.google.c...
To learn more about the nature of confidence intervals, check out my free textbook (Chapter 3): www.how2statsbo...
Also, check out my textbook's companion UA-cam channel:
/ @how2statsbook477
This is the blog site that includes Thom Baguley's function:
www.r-bloggers...


What does bsci mean?
'bsci' doesn't really "mean" anything. It's just the name Thom Baguley gave the function. I'd say it's an acronym for 'Between-Subjects Confidence Intervals'
@@how2stats Thank you! Understanding codes is the most overwhelming part for me to learn R!