Розмір відео: 1280 X 720853 X 480640 X 360
Показувати елементи керування програвачем
Автоматичне відтворення
Автоповтор
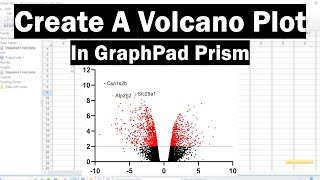
JOIN THE GRAPHING WITH GRAPHPAD PRISM FREE ONLINE COURSEcourses.toptipbio.com/p/creating-graphs-in-graphpad-prism
Wonderfully explained! Thanks a bunch.
very helpful and thank you for your contribution
Great explaination.perfect!
Is there a way to insert the actual OR (95% CI) number as a table to the right of the graph aligned with the appropriate marker on the plot?
It is very helpful!
Thanks!
could this be used for a relative risk too
Thank you so much. Does this program allow to create weights for studies and heterogeneity test?? This is the easiest method I've seen thank you!!!!!!!!
Unfortunately not. If you want something easy, take a look at RevMan or JASP or Jamovi
@@StevenBradburn I have used revman, I'm trying JASP now, it looks good. Thank you again, you're an angel
@@ik4949 you are very welcome. Good luck with your studies. :)
Please create a video on the detailed interpretation of Forest Plot
Hi KhalidI created this, if that helps?ua-cam.com/video/Pxs0gl3hRKE/v-deo.html
You are very welcome


JOIN THE GRAPHING WITH GRAPHPAD PRISM FREE ONLINE COURSE
courses.toptipbio.com/p/creating-graphs-in-graphpad-prism
Wonderfully explained! Thanks a bunch.
very helpful and thank you for your contribution
Great explaination.perfect!
Is there a way to insert the actual OR (95% CI) number as a table to the right of the graph aligned with the appropriate marker on the plot?
It is very helpful!
Thanks!
could this be used for a relative risk too
Thank you so much. Does this program allow to create weights for studies and heterogeneity test?? This is the easiest method I've seen thank you!!!!!!!!
Unfortunately not. If you want something easy, take a look at RevMan or JASP or Jamovi
@@StevenBradburn I have used revman, I'm trying JASP now, it looks good. Thank you again, you're an angel
@@ik4949 you are very welcome. Good luck with your studies. :)
Please create a video on the detailed interpretation of Forest Plot
Hi Khalid
I created this, if that helps?
ua-cam.com/video/Pxs0gl3hRKE/v-deo.html
Thanks!
You are very welcome