Це відео не доступне.
Перепрошуємо.
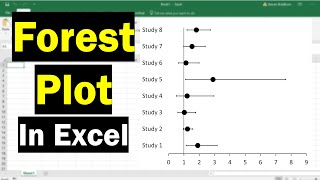
How to make a forest plot in excel

Вставка
- Опубліковано 7 сер 2024
- Turn a bubble chart into a forest plot
---------------------------------------------------------------------------------
#exceltutorials #excelcharts #exceltips
SUBSCRIBE: goo.gl/c46YPs
Microsoft Office 365, Beta Channel, Version 2202
---------------------------------------------------------------------------------


Holy cow, that was quite spectacular! I was entirely blown away by that. Especially the part where you added a series and used the labels to replace the Y-axis numbers. So cool!
Best one I've seen and carefuly explained! With the bubbles is the best way to represent weight sizes, thank you very much.
That was probably the best Forest plot excel tutorial I've even seen! I love your confidence in using Excel! Big thump up!
Thanks Karina
Thank you very much for this, very helpful! The trick to change the markers from circles to squares by copy-pasting does not work in my version of Microsoft 365, which should be the newest. The same goes for the change for the histogram into a diamond. Would anyone have an alternative?
Hello, do you have any method on how to calculate a combined odd ratio?
Hi Karina, can i ask how you calculated the combined values?
How did you calculate the combined values?
i wonder the same...
same, has anyone figured it out?
The video explains how to visualize a meta analysis via a forest plot, not how to actually *do* the meta analysis...