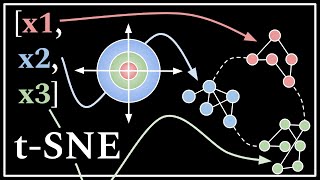
Visualizing Data Using t-SNE

Вставка
- Опубліковано 15 тра 2024
- Google Tech Talk
June 24, 2013
(more info below)
Presented by Laurens van der Maaten, Delft University of Technology, The Netherlands
ABSTRACT
Visualization techniques are essential tools for every data scientist. Unfortunately, the majority of visualization techniques can only be used to inspect a limited number of variables of interest simultaneously. As a result, these techniques are not suitable for big data that is very high-dimensional.
An effective way to visualize high-dimensional data is to represent each data object by a two-dimensional point in such a way that similar objects are represented by nearby points, and that dissimilar objects are represented by distant points. The resulting two-dimensional points can be visualized in a scatter plot. This leads to a map of the data that reveals the underlying structure of the objects, such as the presence of clusters.
We present a new technique to embed high-dimensional objects in a two-dimensional map, called t-Distributed Stochastic Neighbor Embedding (t-SNE), that produces substantially better results than alternative techniques. We demonstrate the value of t-SNE in domains such as computer vision and bioinformatics. In addition, we show how to scale up t-SNE to big data sets with millions of objects, and we present an approach to visualize objects of which the similarities are non-metric (such as semantic similarities).
This talk describes joint work with Geoffrey Hinton. - Наука та технологія


Nicely presentation - I'm a naive layman, but I was able to follow along and see how this is a useful technique. Thank you for sharing!
Wonderful talk, very clear, giving by a wide margin the greatest real-world impact of any Google talk I have seen.
That visualization at 20:31 is so baller. Such savage domination over the competing algorithms
All papers cherry-pick their examples to show superiority of their new algorithms. You need to take it with a grain of salt.
Thank you so much. One of the best talks I ever listened to!
Great talk, crystal-clear. Thanks.
Such an impressive work which i should carefully read before!
Very clear and insightful presentation. I cant wait trying it out myself.
Excellent talk and congratulations.
Great stuff - I'm thinking it's time to get more deep into t-SNE for more insights about our data.
great performance with simple ideas!! Fantastic!
One of the best presentations I have ever seen in ML
Thanks! this is so explicit.
Make sure to also look up UMAP!
Was that first question asked by UC Berkeley's Jon Deniro????
didn't get hinton's introductory talk, what was the four and the 12 that he was talking about?
I am interested in looking at the interactive 3D tool on your website visualizing your data, do you have a direct link to the interactive plot that you can share? Thanks in advance
Great talk!
very good talk. thank you very much.
AMAZING!
hello my friend nice film and like, nice to meet you
Thank you very much!
I assumed that the quadtree (27:06) is built for the original point set x_i in the high dimensional space. Can anyone explain how this can be done for points lied beyond 2D?
oh, never mind. The quadtree supposed to build for y_i. :-) Found the paper describing that part lvdmaaten.github.io/publications/papers/JMLR_2014.pdf
can someone explain how t dist separates dissimilar points to be modelled far @20:10 ?
That's why Google is the best company on earth
*HOLD TIGHT t-SNE*
He's got a pumpy.
(big ting)
lmao
the association no one asked for but we all needed
Hi Guys, can someone please explain why symmetric probability is Pij = (Pi|j + Pj|i)/2N and not Pij = (Pi|j + Pj|i)/2 ?
The denominator for Pij will have n*(n-1) terms whereas Pi|j will have n-1 terms
I guess it is as follows, Pij = (Pij + Pji)/2 = (Pi|j * Pj + Pj|i * Pi)/2, where Pj and Pi are both 1/N.
What is a "high dimensional" object ?
I guess something u give more propertys Like a point in a room with a temperature and maybe a pressure value. (witch would be 5D 3 for space one pressure and one more for tem) I Guess with high they mean stuff that has more than 2 values. Because that is Easy on a 2D graph. ;) But Maybe im worng. (I'm not a googel genious)
Jay Jabber thanks
link to website: lvdmaaten.github.io/tsne/
+majestia19 The link on the last slide redirects to this github page full of tSNE info.
why everyone using deep learning for image or text?
I want to use deep learning (and use t-SNE for visualization) on bioinformatic dataset I've collected. that dataset is ,I can say larger version of IRIS dataset with 512*16 . How to do classification show it in t_SNE?
at 2 minutes, have you heard of a heatmap? That can visualize thousands of variables at a time.
Clearly you do not understand the difference between visualizing "thousands of variables at a time" and multi- dimensional data...
There is no difference - variables and dimensions mean the same thing. The data are zero-dimensional points that live in high-dimensional space (equivalently, the data have a high number of variables). t-SNE takes a matrix of data as input (e.g. data-points as columns and dimensions as rows). The data could be 'visualized' using Excel ... or one better a heatmap. I'm just surprised that Laurens doesn't mention this.
I agree that variables and dimensions are sometimes used as synonyms, however there's a big difference when talking about high-dimensional data. t-SNE does not take just one matrix as input. It takes MANY matrices at once, that's what multi-dimension means. An excel sheet or a heat map can just be used to visualize 2 dimensions (columns and rows). Heat maps can add a third one using color. If you get creative, you might be able to pull off a 4th dimension, but when you are trying to analyze let's say 40 dimensions... A heatmap just can't do the job UNLESS you use something like t-SNE to reduce those 40 dimensions into something more "manageable" or understandable (2-D, 3-D)
That is not correct. First, t-SNE takes a single matrix not higher order tensors. Second, a matrix can be set up in the following way: data-points as columns and dimensions as rows. In this way a matrix can ‘visualize’ thousands of data-points (as thousands of columns) living in thousands of dimensions (as thousands of rows). A heatmap just uses color to visualize the numbers in the matrix. It is a misconception that dimensionality reduction is the only way to visualize high-dimensional data.
I don't think I get your reply, so I will try to apply it to an example. I measure the intensity many different parameters on cells. Each parameter will have a value. We do this with thousands, sometimes millions of cells. The data we get shows cells (rows) and each parameter on a column. The actual value just expresses the intensity of the measured parameter. We do scatter plots for each parameter "A" vs "B" to see if some populations emerge, then we do the same for "A" and "C", "B" and "C", etc... But when you have more than 30 parameters to compare against each other, it becomes very hard. And also you sometimes can lose the interaction that can exist within 4 or more parameters that is characteristic of a specific population. How would you "visualize" this in a heatmap?
Too hard to understand.
I was very hard to hear the question from the audience also we never saw the person giving the talk, what's up with that ? Don't you realize that body language and facial expressions is an important part of communication ? Why have video cameras if you're just going to show the powerpoint ?
This was a teleconference. The speaker probably didn't have a webcam enabled, instead he transmitted the slides over his "webcam" feed.
Lissen up, Shodan ten-higher-than-any-other-shodan,
Just be grateful half the video didn't show the back of the guy's head as he wrote on a chalk board.
A little gratitude, hunh?
Pre-typed Power Point slides! Modern technology!
On your knees and apologise, Sho.
geinus
much geinus, very wow
You bail out boats on rivers for the same reason you bail out banks: to keep them from going under.
Cheerleaders and sports are both voyeuristic attractions, for audiences.
Machines can spot these associations, even if poor keyboard-trapped humans don't get it.