Central Limit Theorems: An Introduction

Вставка
- Опубліковано 6 вер 2024
- This video provides an introduction to central limit theorems, in particular the Lindeberg-Levy CLT. Check out ben-lambert.co... for course materials, and information regarding updates on each of the courses. Quite excitingly (for me at least), I am about to publish a whole series of new videos on Bayesian statistics on youtube. See here for information: ben-lambert.co... Accompanying this series, there will be a book: www.amazon.co....


Brilliant, your videos have literally gotten me through an entire econometrics degree.
I think this video is definitely one of the best videos on UA-cam which explain CLT and WLLN. Don't know why the number of views is so small. Anyway, thank you so much for the clear explanation.
Ditto Nathan’s comment, a lot of students owe you a great deal of thanks!
Great video!
Not sure I understand the misconception you mentioned. If you divide by sqrt(n) you get a probability whose variance goes to 0 as N goes to infinity - so both sides turn to be constants, as a distribution with variance 0 is essentially a constant.
Surely dividing the variance by n is not 'nonsense'.. at least, it helps with my intuition. It means (xbar - mu) converges to a N(0,0) distribution, which is like you say, a degenerate distribution, and can (and should) be written as 0.. But is not entirely 'wrong', as for finite sample sizes, it surely is correct? It is just in the realm of asymptotics where it becomes degenerate.
thank you for the nice explanation
Graphs on 6:48 are also pdf's, right?
Thanks for your videos. They're awesome!
Clear and concise as usual. Thank you
Dear @Ben Lambert, would you mind explaining the maths between the concept at 11:04
I get the result but not while multiplying by 1/sigma would lead to 1...
thank you , really.
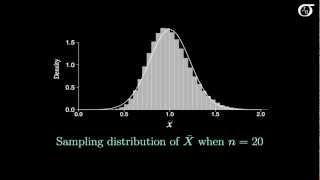
At about 2:40 you asked, "what happens if we increase the size of the sample?" My question is, what would be the difference between increasing the size of the samples, compared with increasing the number of samples taken, or are they basically the same thing?
Also, if converging in distribution causes convergence to a constant, is this the same as converging in probability?
Thanks for the video, very useful!
Usually we only consider one sample from the population. Here we are concerned with the theoretical distribution of an estimator for a given sample size.
The second statement is actually not correct. Convergence in probability implies convergence in distribution but not vice versa.
brilliant explanation
Dear Ben, I started studying R language and decided to check the CLT on i.i.d. variables which PDF is defined over a range limited on one or both ends. I started with applying the CI formulas based on the CLT to i.i.d. variables with beta-distributions and uniform 0-to-1 distributions and the sample mean close to 1 and got the 95% CIs that span over 1.
Then I ran Monte Carlo simulations on R with different parameters, for instance: i.i.d. lognormal variables with μ = −0.5, σ = 2, 10 000 iterations of drawing a random sample of 10 000. The simulation gives me the difference between the mean of and median of the sample mean distribution equal to 12.7% of SEM, and the difference between the 5th percentile and the mean of the sample means and the 95th percentile and the mean of the sample means equal to 32% of SEM. It seems the CLT just doesn't work... at least for the i.i.d. variables that don't take all the values between −∞ and +∞.
My code in R:
x1
Now I decided to run Monte Carlo simulation for several sample sizes to see if the asymmetry of the sample mean distribution diminishes when the sample size grows. And it seems to do so. So I assume that the sample mean distribution does converge to a more symmetrical distribution. However the degree of asymmetry at sample sizes up to the range of 10 000-100 000 are still significant, which compromises the validity of using z (or t) statistics to precisely estimate the location of the population mean or in hypothesis testing. Below is my R code (it takes many minutes to finish the calculations):
m1
In other words, even with the sample size of 100 000, if you try to find a 90% CI for the population mean with the z-score of 1.64485363 or t-score of 1.64486886, the distance from the lower bound of CI to the mean point estimate should be around 5.8% shorter than the distance from the upper bound of CI to the mean point estimate. This is pretty significant, isn't it?
amazing! very clear explanations
Can you stop saying "sort of" in every sentence. It's like when americans say "like" all the time.