Scatter Plots, Regression on the TI-83+ TI-84+

Вставка
- Опубліковано 19 сер 2024
- For statistics students,
How to enter data, create a scatter plot, find the correlation coefficient "r" and the linear regression equation to plot a line, all in 5 minutes! Least-squares regression.


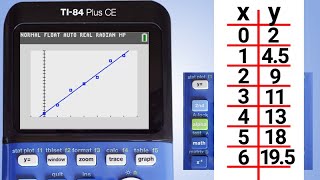


ONCE YOU PUT IN THE DATA AND TURN ON THE PLOT, PRESS ZOOM, 9, And it will fit the graph perfectly to the scatterplot.
thank youuuu
THANK YOU ILY
My teacher spent 75 minutes to “teach” me this, and yet I couldn’t grasp it. But now, in five minutes, I’ve grapsed it. I love these UA-cam videos. I watched videos for chem (Tyler DeWitt has the best chemistry videos) and math. Thank you!
K. A. In a perfect world, the teacher points you to the technical stuff, like learning the calculator, (which is online) and spends the time teaching the math. That’s pretty much why I made these videos.
You can also go to “vars” and click “Function” and then press “Y1”.. which will store the exact linear regression line in Y1 to graph it. Either way
I love teachers like this that go above and beyond to help his students(: you are the best! Thank You so much
Thank you, thank you, thank you! All I needed was the correlation coefficient line on my scatter plot and I looked everywhere for just that and you showed me thanks!
I think this is a great video especially when you're not exactly sure of how to input the data and how to get the rest of the necessary required info - thanks for making the video - it's was worth watching and learning!
Dude this helped me so much because I couldn't find "r=" at all. Thank you so much!
Life-saver. Thank you so so much! Definitely taught me in five minutes what my stats teacher couldn't in 5 hours of class time.
I'm so thankful for this video. I couldn't figure out how to find r on the calculator for a week, but it's so simple! Thanks :-)
For future reference, and because I am a college student and I know how much it drives us CRAZY when Professors do this, you should clarify the contents of L3. For some reason you only mentioned L1 and L2, and there were only 2 variables (and 2 columns of data) but I was so confused when I saw 3.
Andrew bone this video meant so much to me
thank god i have statistics and this class is a pain in the arse
yes finally I really needed this this was great! Now I'm finally going to pass algebra2! Thank you so much!
great video, helped me a lot for final exam
"oooooooo yesss" 4:53
Oh my god thank you you're a lifesaver!!!
you screwed up the xmax, the highest value was 310 horsepower for the ford excursion. but great video thanks!!!
"oooo ANOVA is in here thats cool" LOOLLLLLLL 3:21
i like your style.
THIS VIDEO IS AMAZINGGGG, THANKS!
Wondering how this can be correct, when the Ford, not the GMC, had the most HP and it was 310. The value set for Xmax was 300.
Thank you for this video !!!
Thank you for the great video.
excellent video!
very helpful!! thanks!!!
Ty!!
Thank you so much
when a 2010 video helps you in 2020
just curious what is the difference between r and r^2?
u could have pressed zoom 9
I know I already did that like 3 minutes before he had the graph set up
you saved me.
My cousin who is in 5th grade has to this in her school. COMMON CORE
+nzblaster26 Yikes. The common core doesn't specifically state that 5th graders need to be able to plot data on an x,y axis nor computer/plot a regression line. her teacher might be introducing extra material. This is is typically taught in 11th grade.
I wasn't taught this at all. I live in the south like in the deep south.
+nzblaster26 You give me hope for the future. You and others who seek out your own learning will be more successful than your peers. Don't let where you come from define who you are. John Nash, the Nobel prize winning mathematician/economist, grew up in Bluefield, West Virginia.
thks alot
Thank u so much :')
When I do my line of regression it goes through none of the data points it is below the entire graph what am I doing wrong?
anyway to do this with only an equation, not the data?
shot040 yes there is. After a regression is computed, the equation can be plotted by itself with no data points showing by turning off the Plot . Another way is to clear the lists holding the data.
how to you clear the plot from the caclulator? i try to clear data under statistics, but i get an error
+Evan Lynch , go to stat, edit, then make sure for example, L1 is highlighted the lable not the input rows below, and hit clear and then hit the down arrow and it should clear.
smart
nobody wants to hear bout a damn Ford James
doom