How to Make Better Graphs - The Data Ink Ratio

Вставка
- Опубліковано 14 жов 2024
- In this beginner's guide to the Data Ink Ratio, learn how to create better charts, graphs and data visualizations in this demo tutorial using the Data to Ink ratio. Edward Tufte's Data to Ink ratio is the one data visualization rule that everyone needs to know. Regardless of whether you’re using Tableau, Power BI, Excel, PowerPoint or Illustrator. You may have the best data, insights or analytics skills in the world, but if your charts, graphs and data visualizations are confusing or boring, then it's all for nothing. In this demo tutorial find out how you can start using Edward Tufte's data to ink ratio in your charts, graphs and data visualizations


Let me know what you think - I read and reply to all thoughts and feedback! Want to get better!
Most underrated channel
You just gave a design lecture! that is what I do to make interfaces more intuitive as well, it applies everywhere
you are very good at making things quick yet understable
Thanks 😊
Without a doubt one of my favorite videos breaking down how to communicate insights. Amazing!
Feel very honoured to hear you say that! So glad you liked it, and thanks so much for sharing! ☺️
Your channel should get so much more views! Thanks for sharing this type of info with us, you made me understand for the first time how to use charts and how to think on what I want to convey when I visualize data
Thank you! 😊 Glad it helped you! Good luck with your data visualisation!
This channel is underrated and underviewed. Please consider spending some money on marketing. You have a great yet simple and easy to understand content, and it gets buried by UA-cam algorithms.
Thanks Osama. Really appreciate your encouragement. I’ve been doing it as a bit of fun so far, but maybe I should! The UA-cam algorithm is an interesting one! 🤣 Thanks again and take care.
Awesome progress of the video.
Glad you enjoyed it ☺️
This helped a lot. Very informative! thanks!
The ONLY thing I would perhaps disagree on (and disagree is probably not the right word, maybe more playing devils advocate?) is that removing the color from Zoom makes the audience spend a few more seconds identifying which bar Zoom represents. If it is kept in color, it’s easily identifiable. I guess that is when knowing your audience comes in handy. If they were more focused on JUST TikTok and not necessarily TikTok vs Zoom then yes, if they were really focused on Zoom as well then probably leave them both highlighted. Just my two cents, and probably just more of a personal preference 😊
"Data visualization is very simple, but playing keeping in simple is the hardest thing there is.”
Good video!
Thanks!
Nice clean work. Lovely
Very satisfying doing this!
Hey! Very Good videos, which tool for the chart you used for this tutorial? Excel, tableau, etc. Thanks and keep sharing your knowledge
Hey Rodrigo. This is all done in PowerPoint! So really basic, but it’s integrations with Excel and PowerBI make it a lot more capable from the back end (I.e. data), and Microsoft have ‘taken inspiration’ from Adobe on some nice new features for the front end (I.e. design). So it’s getting better and better as a visualisation tool.
And thanks for your kind words!
Increíble, muchas gracias por el aporte.
This man here is a Legend
Damn that was a good example.
Joseph… you’ve made my day with that comment! Thanks!
incredible
Thanks! ☺️
Wish I found this channel earlier.
More to come soon Shawn. Hopefully to take things up a level as well!
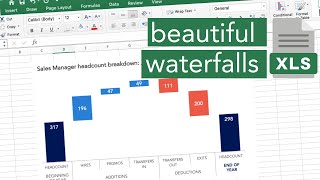
80s-style chart --> 21st century clean style