Tsunami Forecast Model Animation: Three Tsunamis in One Day From the Tonga-Kermadec Subduction Zone

Вставка
- Опубліковано 15 бер 2021
- The Tonga-Kermadec Subduction Zone is a convergent boundary where the Pacific is subducted beneath the Australian Plate. It extends northeastward from New Zealand, through the Kermadec and Tonga Islands, and terminates just south of the Samoan Islands, covering a distance of about 2800 kilometers or 1800 statute miles. This boundary is also a source of large, shallow, undersea megathrust earthquakes and thus a source for tsunamis.
On 4 March, 2021, three earthquakes along this boundary each generated a tsunami within a single day. In fact, they all occurred in a little more than six hours. The first struck northeast of Gisborne, New Zealand, with a magnitude of 7.3 at 13:27 UTC. New Zealand issued tsunami warnings for its own coasts, and tsunami waves as high as 28 cm or 11 in. were observed there. Just over four hours later the second earthquake struck in the Kermadec Islands, northeast of New Zealand’s main islands, with a magnitude of 7.4 at 17:41 UTC. It also produced a small tsunami, with measured wave heights of 36 cm or 14 inches at Raoul Island. That earthquake turned out to be a foreshock for a much larger event that struck the same area just under two hours later with a magnitude of 8.1 at 19:28 UTC. It prompted the Pacific Tsunami Warning Center (PTWC) to issue a Tsunami Warning (evacuation recommendation) for American Samoa, and a Tsunami Watch (possible hazard, analysis continues) to the State of Hawaii. Within an hour PTWC reduced the threat level to a Tsunami Advisory for American Samoa, meaning that a hazard remained offshore but that flooding was unlikely. About three hours later PTWC cancelled both the Advisory and the Watch when they determined that any hazard had passed. PTWC, however, continued to monitor the tsunami and provide hazard guidance to international emergency managers as it crossed the Pacific Ocean, standing down only after the waves had reached South America 20 hours after this third earthquake occurred. Sea-level gauges recorded the tsunami throughout the Pacific Ocean. Measured wave heights exceeded 55 cm or 22 in. at Norfolk Is., Australia and was nearly as high in the Galapagos Islands. In the United States the waves were about 18 cm or 7 in. high in Crescent City, CA and Kahului (Maui), HI.
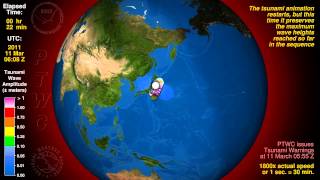
PTWC creates animations with the same tool that it uses to determine tsunami hazards in real time: the Real-Time Forecasting of Tsunamis (RIFT) forecast model. The RIFT model takes earthquake information as input and calculates how the waves move through the world’s oceans, predicting their speed, wavelength, and amplitude. This animation shows these values through the simulated motion of the waves and as they travel through the world’s oceans one can also see the distance between successive wave crests (wavelength) as well as their height (half-amplitude) indicated by their color. More importantly, the model also shows what happens when these tsunami waves strike land, the very information that PTWC needs to issue tsunami hazard guidance for impacted coastlines. From the beginning the animation shows all coastlines covered by colored points. These are initially a blue color like the undisturbed ocean to indicate normal sea level, but as the tsunami waves reach them they will change color to represent the height of the waves coming ashore, and often these values are higher than they were in the deeper waters offshore. The color scheme is based on PTWC’s warning criteria, with blue-to-green representing no hazard (less than 30 cm or ~1 ft.), yellow-to-orange indicating low hazard with a stay-off-the-beach recommendation (30 to 100 cm or ~1 to 3 ft.), light red-to-bright red indicating significant hazard requiring evacuation (1 to 3 m or ~3 to 10 ft.), and dark red indicating a severe hazard possibly requiring a second-tier evacuation (greater than 3 m or ~10 ft.).
Toward the end of this simulated 30 hours of activity the wave animation will transition to the “energy map” of a mathematical surface representing the maximum rise in sea-level on the open ocean caused by the tsunamis, a pattern that indicates that the kinetic energy of the tsunami was not distributed evenly across the oceans but instead forms a highly directional “beam” such that the tsunami waves were higher in the middle of the “beam” of energy than on its sides. This pattern also generally correlates to the coastal impacts; note how those coastlines directly in the “beam” are hit by larger waves than those to either side of it. - Наука та технологія