Interpolate voids in DEM for catchment delineation in QGIS

Вставка
- Опубліковано 20 вер 2024
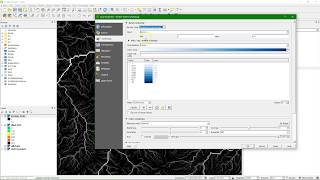
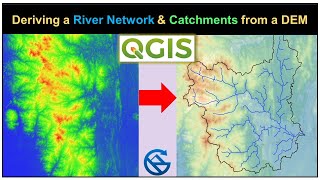
- This video shows how to interpolate voids (nodata pixels) in your DEM when you want to delineate catchments and streams in QGIS (see • Stream and catchment d... ).
This video is part of IHE Delft OpenCourseWare. More free resources can be found at www.gisopencour...
For an overview of our GIS courses and info on tailor made trainings and advise see our folder: www.un-ihe.org...
More information about the book "QGIS for Hydrological Applications - Recipes for Catchment Hydrology and Water Management" by Kurt Menke and Hans van der Kwast can be found at the website of Locate Press: www.locatepress...
IHE Delft and Nieuwland Geoinformatie offer an online course. It includes support from experienced trainers and you'll get the official QGIS certificate after completion. More info at: www.learning-gi...
Subscribe to the UA-cam Channel for updates!


Thank you for this, I couldn't find the right tool
Thanks for sharing your knowledge with us. I encountered a problem with a 32bit DEM that seems to have a sort of mask when I open this in Photoshop: the sea-level is all black and the rest is white. I try to save it as a 16bit file to access the height values, but the part covered by black is all level at the same value, it seems. Did I export it wrongly from QGIS to a TIFF-file? Many thanks in advance. Grtz mrcl (NL) 👍
hi! in the Warp tool you didn't really explain why you chose that specific target CRS... I'm trying to understand what I have to choose for mine
Reprojection is needed for DEM analysis, because you can't work with the Geographic Coordinate System (EPSG:4326). If you work for a national government, use the national projection. If it's not clear what they use in your country or region, you can use a UTM projection. See this playlist for more info about projections: ua-cam.com/play/PLeuKJkIxCDj1c0ffAkIb5P1-80lporfbU.html&si=6IqCbYhzaXAbRH88
I have problems with this area of the desert of Mauritania. It is very flat but there are still many voids. My most pressing question is why these voids have a pattern. 22.00N 11.40E
My problem is that I don't know if this pattern is an artifact of the radar scanning method or if they are actual topographic features. I have a hand drawn map of the area that indicates they are real ridges.
Good afternoon! could you please help me the procedure of closing gaps, algorithims to fill nodata and DEM intepolation please
Did you watch the video? It is exactly about this topic.
thanks for the video,. I followed the steps to fill voids, the range of data before filling was -88 to 3633 and after run, the resulted DEM data rang from -32765 to 3633 . note that -32765 is the NO Data Value of the raster. please, how to correct the range of values (elevations).
You can add an additional nodata value in the Layer Styling Panel under Transparency. That's okay if you want to visualise.
For calculations use: Raster | Extraction | Clip raster by extent... Choose the layer extent as extent and fill in -32765 at "Assign a specified nodata value to output bands".
@@HansvanderKwast Thank you so much
Hi Hans
We want to increase the resolution of the SRTM DEM with digitized countours and altitude points from topgraphic map. How to merge them in one DEM ?
You can convert the SRTM raster to points with the "Raster pixels to points tool" and then add the different layers (points and contour lines) to the TIN interpolation tool, which results in a raster. Both tools are in the QGIS Processing Toolbox.
@@HansvanderKwast Thanks so much.
Dear Hans,
I tried the technique to interpolate voids in a DEM and it is returning an error;
The following layers were not correctly generated.C:/Users/Stanley Phiri/AppData/Local/Temp/processing_d840d7e3a4a945bcb7e5f8d19593444b/038e02f034c548a189a4fa86c5148393/OUTPUT.tifYou can check the 'Log Messages Panel' in QGIS main window to find more information about the execution of the algorithm.
Please assist
A few things that could cause the error. Did you reproject the DEM as shown in the video? It shouldn't be in EPSG 4326. Also check if you haven't got spaces or strange signs in the output folder and file name.
-1.79769e+308