Nonlinear Regression in Microsoft Excel

Вставка
- Опубліковано 20 лип 2024
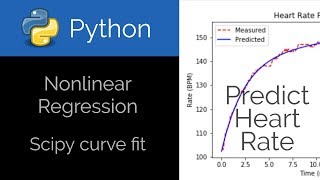
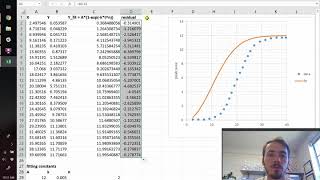
- A three parameter (a,b,c) model y = a + b/x + c ln(x) is fit to a set of data with the Excel solver add-in. This tutorial walks through the process of installing the solver, setting up the objective (normalized sum of squared errors), and adjusting the parameter values to minimize the SSE.
- Наука та технологія


Wow, this could be one of the most powerful videos on youtube. I've been trying to make an inverse square fit to my data, and I can't tell you how many forums and videos I found where the person just fits an exponential. Bravo, you saved me the hour I would need to go back to my numerical methods notes haha
Thanks Paul! I'm glad it helped
Thank you sir... You taught an old dog a new trick!!! Wishing you the best from Puerto Rico!!!
Thank you for this tutorial. Very useful. My first use of Excel's Solver. Best of luck.
Very simple procedure *after* someone points how-to. Thanks for your time!
THANKYOU SO MUCH!!!! I dont know how to tell you how much your video helped me.Thankyouuuuuuuuuuu.
Very useful, concise and excellent video. Keep it up bro!
As always, you're the best!
Thanks for sharing this video. I'm trying to model a function which involves a decaying exponential and multiplying by the inverse square of x. I had been struggling of figuring out which parameter to minimize until I came to the conclusion the percent difference would work as it normalizes the residuals and makes the really tiny number just as important as the larger numbers.
Your video helped to independently verify my thinking was on track. Thanks!
I'm glad that you found it useful.
Thank you very much! It is very informative.
Great explanation, thank you so much!
thank you for this very useful tutorial!
THANK YOU SO MUCH FOR THE TUTORIAL
That helped me a lot. Thanks a lot
Excellent!
Thank you very much. Quite informative and useful.
Glad it was helpful!
Hi, thanks for the useful video!
I am wondering how you decided that the y = a + b/x + c ln(x) formula was the most appropriate formula for your data and could you please elaborate on what the y = a + b/x + c ln(x) formula is?
Thanks!
Samuel Cron, the formula was created just for this exercise and could be replaced with any formula of explicit form where y=f(x). If you don't know what formula will fit your data, you can do three things (1) try a linear regression (2) if not linear then examine the fitting error and see if it appears quadratic, logarithmic, exponential, etc. (3) try other model forms and evaluate how well it fits with an R squared, sum of squared errors, or sum of absolute errors.
That makes sense!
Thank again
Thank you sir for your help👍🌹
Thank you for a great tutorial.
May I know, can excel solver able to solve when ln (MR-C) = ln a - Kt when we only have data for MR and t and need to find the constant value which is a, K and C?
Yes, that is possible with Excel. You'll just need to modify your problem for making the unknown parameters adjustable.
Awesome sir... (Y)
Thank you for the explanation. I would like to calculate the R^2? How do you calculate this value?
You can use the RSQ function in Excel.
The best Sir😍
Thank you so much!
How do you find uncertainy parameters? I have a concentration vs absorbance plot, which resembles logarithmic curve. I can find the concentration at recorded absorbance using the nonlinear regression equation, but what about the uncertainty?
Here is some help on the uncertainty analysis: apmonitor.com/do/index.php/Main/ParameterStatistics The two experiments are both from a kinetic rate equation that also resemble a logarithmic curve.
Excellent content!
Thanks, Francisco!
how did you come up with this equation in the first place y= a + b/x + c ln(x)?
+jpaokx it's just an example problem when you already know the equation that you want to use and there are some unknown parameters. If you don't know the equation then you should start with a linear regression. If the error is too large then maybe add bi-linear (x1*x1, x1*x2, x2*x2) or other nonlinear elements. You can use an R^2 statistic or sum of squared errors metric to track which equations preform the best.
Thanks!
Excellent
Hey ^^ How do we process when we have two variables x1 and x2 ?
+nForgotteNation, just add the additional terms to the summation that defines your objective function. The solver can have only one objective function so you have to sum up all the squared errors.
May I know is x-plot data random? Thank youuuu!! Useful video!!! Likeddd
+Taiko1122 no, it isn't random but you could make it random.
On the nonlinear regression data.xlsx sheet, are the actuals in B5:B7 constant for any problem. I missed in the video how those values are determined. Thanks.
Those values are the "True" values that we are trying to estimate from the data. You could change the values in B5:B7 and then re-run the regression to see if the solver can get close to the correct answer.
is it possible to generate a equation from the characteristics of some graph?
That is a great machine learning topic. For simple correlations, you can use "Add Trendline" in Excel and browse through different correlations that may best fit the data.
Geee, nice excel vid... thanks..:)
Thank you so much for posting this. Ques: If there is a high covariance between the parameters (a,b and c) what does this tell us? Is this bad? If so why? thanx!
The parameters are single values so there is no covariance between them. If you have a high degree of covariance between data (x, y), it means that the two variables have a strong linear relationship. If one goes up, the other also goes up (or down).
This is very helpful. However, I want to fit a complex function which have two part real part and imaginary part (such as Debye model for dielectric constant). It would be helpful for me if you make a tutorial for fitting complex function.
Thank You
Here's some help on complex numbers in Excel. Thanks for the suggestion. support.office.com/en-us/article/complex-function-f0b8f3a9-51cc-4d6d-86fb-3a9362fa4128
Hi, this video is very interesting, I read your comments about trend lines and you explained that “the common way to evaluate the goodness is R^2”; for example I have the values of x and y and I applied all of these. If I choose quadratic the R^2 is 0.997 but if I choose cubic expression R^2 is 1. It’s possible to compare the coefficients of the two equations and to determine what is the negligible value: quadratic: y = 7E-10x^2 - 2E-05x + 1.1516, cubic: y = -3E-14x^3 + 1E-09x^2 - 2E-05x + 1.1529 for the target.
What could you recommend?
Please and thanks
You'll need the Excel Add-in for this statistical analysis. You can check your p-values and they should be less than 0.05 for the term to be statistically significant.
Thank you for the explanation, the value of 0.05 is an standar value or it depends the other parameter to compare?
I´m interesting in this topic, would you recommend another video to explain that, Please
Thanks
Yes, 0.05 is standard for a p-value cutoff for significance. There are good videos on Kahn Academy on stats. An introduction to stats book would also be a good place to start.
I understood your explanation but in my example both equations have p-values less than 0.05, It's possible to choose the equation that has the lower p-values in comparison with the other model?
How can I recognize from the statistical analysis (excel) if the model is linear or non-linear from p-values, confidence level, etc.
Thank you for everything!!
Be careful when using polynomials. Adding .in terms will increase the R2 value, but only because the curve loses a degree of freedom.
As you add more terms to a polynomial, the polynomial starts to "cater" to the data. This means the "model" you are trying to use to describe your data starts to take the noise into account.
For more on this, look up nonlinear regression - overfitting here on UA-cam.
Is there any way to calculate the errors associated to the estimated values of the free parameters? Thank you!
Yes, there is a summary from Excel if you use the stats add-in. There is more on parameter confidence intervals here for linear and nonlinear regression in Python: apmonitor.com/che263/index.php/Main/PythonRegressionStatistics
Will this work with multiple X variables, for example X_1, X_2, X_3, X_4? Also, what if I raise e to the power X_4 * an unknown constant (e^(CX_4)) or what if I square it? (e^(CX_4))^2
y=A+BX_1 + CX_2^2 +De^(x_3)+e^(F x_4)
Yes, all of those should work. Sometimes with more nonlinear equations, the solver may struggle to find a solution and so you may need constraints on your variables or else give better initial guesses.
Thanks
Can you tell me, what if I need to solve an equation like this : y=e^(A1x1)+e^(A2x2)
A1,A2 are arbitrary constants, x1,x2 are independent variables. Will this solver work, or if not can you recommend another solver? I can only find videos which say to take log of both sides but that is for only 1 e^x term; I'm pretty sure that method wouldn't work for multi variables.
+Fahraynk, you should be able to use the Excel solver for any optimization problem and with any nonlinear constraints. There is typically no need to rearrange the equations although sometimes taking the log of both sides can help the solver find a solution. It is a GRG (Generalized Reduced Gradient) method in Excel by default. apmonitor.com/che263/index.php/Main/ExcelSolver In my experience, you can have up to about 100 variables with good results. Your problem has only 2 so you should be fine.
Thanks so much for your reply! I have to figure this out for these chem people tomorrow. I am the only math guy in the lab, but this is mostly computer science so I am trying to cram regression analysis as fast as possible hahaha.
thanks , but how can i find R square for the fitting line?
+عثمان العبدالوهاب You can use the Excel RSQ function to evaluate the R square value. You just need to select the model and measured columns as the two inputs to the function.
Thanks a lot. This was great. I have a question: the only challenge I have is coming up with the right formula to begin with. Why did you choose that formula. The rest of the steps will be easy if we have the proper formula form. What to do in case we don’t have that formula.
Also when you calculated the error squared, why did you divide by the measured value before that? Won’t the difference squared be correct?
Thank you very much ❤
Try machine learning regression if you don’t know the model form: APMonitor.com/pds (see regression section). Both objective forms are okay. The scaled form is better when there is a large magnitude difference. If you want the 0.01 measurement to be as important as the 100 measurement (percentage-wise) then use the scaled form.
if x(i+1)=a*x(i) + b*exp(c*x(i))+error(i) how to solve it.
please help me with matlab or excel....
You typically assume that the error is zero when performing the regression. You can calculate error(i) after you perform the fit. There are tutorials on regression at the following links:
Excel: apmonitor.com/che263/index.php/Main/ExcelDataRegression
MATLAB: apmonitor.com/che263/index.php/Main/MatlabDataRegression
Python: apmonitor.com/che263/index.php/Main/PythonDataRegression
Python GEKKO: apmonitor.com/me575/index.php/Main/NonlinearRegression
This problem is unique because you have a time series model where the next x(i+1) is dependent on the prior x(i) but it can still be fit into the regression form. Every measured x(i) is just a new data point and equation for fitting. These tutorials are on fitting time-series data:
Excel/MATLAB/Python: apmonitor.com/do/index.php/Main/DataSimulation
Good video sir! It really helped me. Please, what if you have 2 set of data for the y-axis? How will we set the objective this time?
You can either add the two objectives together to create one objective or else use a Pareto front analysis if they can't be combined. Here is more information on Pareto fronts: apmonitor.com/me575/uploads/Main/chap6_genetic_evolutionary_optimization_v2.pdf (See section 6.5 of the book). apmonitor.com/me575/index.php/Main/BookChapters
Thanks a lot
Hi how can i minimize two functions simultaneously in excel?
Thank you very much.
I have three data sets, how can I use excel to show that they all follow the same trend. I already know the general expression. So how can I show that they all follow the same trend using excel least squares fit and also the trend is non-linear?
If you want to show that they statistically follow the same trend then I recommend an F-test as shown here: apmonitor.com/che263/index.php/Main/PythonRegressionStatistics If you just want to create trends and see if they are close then the material here should help: apmonitor.com/che263/index.php/Main/ExcelDataRegression
How do you do it if you dont know the value of a, b and c in advance?
An initial guess is always required. You could set them to [1,1,1] by default.
good video, but how to know the right model that would eventually fit your data?
If you have just a couple variables then I'd recommend that you plot the data first. You can also start with a linear model and then use higher order polynomials as a first test.
do you even regress, bro?
also , if i want to make error as minimum as 10^-9. how to do it?
+عثمان العبدالوهاب Please see the solver dialog box at 7:50 in the video (Options Button next to the Solver Selection for GRG). You can set a solver option to converge to a more accurate answer.
If you want to force the solver to fit the data better, you may need to add more coefficients to your model. If you need the sum of squared errors to equal a certain value, you can set the objective function value to a particular value and tell the solver to work until it finds the solution. This may generate an infeasible solution, however.
Trying to fit a set of data that could potentially fit hyperbolic relation, would this also apply to that?
Yes, you can include any nonlinear equation instead of just the one that I showed. You can also include sets of equations such as an artificial neural network such as those that use hyperbolic tangents.
sorry, Im new to curve fitting. How did you come up with the actual and estimated values?
Crystal Pan, the actual values are true values from a physical process - they are normally not known. The estimated values are from the model predictions that take the inputs and translate them to predicted values or the estimates of the actual parameters.
thank u sir
Hi! Very useful.... but could I ask you something regarding about this problem?
1. How about the limit of this method (Microsoft Excel)? Can you compare them results with another method (Matlab...)?
2. If I use another model more complex. Ex: y=a(1-exp(-bx))+c(exp(dx)-1), four parameter (a, b, c, d)) ==> we can do it or not?
Dao Van Hung, check out my course at apmonitor.com/che263 the examples are in Python, MATLAB, and Excel
thanks!
How would you solve the same example, with x plot and y plot reversed (y Plot is given)?
this shouldn't be a problem. What function do you have? In this case, you would just algebraically rearrange your y(x) equation to be x(y). You would fit the equation in the same way as shown in this tutorial.
Its the same equation, y= a + b/x + c ln(x). But in my case i don't know values of x, so I need to express x. Buti guess I would need some kind of aproximation.
tine plavčak You would need to employ a nonlinear solver. The Solver pack shown in the video would work... you would vary the x until you found the correct y. Another example that comes to mind is Newton's method.
When I select the 'Ok' for Solver result window, I get an error. The error is:
Run time error '53'
File not found: Solver32.dll
How do I correct this. Please help.
Thanks
Does this help? confluence.som.yale.edu/pages/viewpage.action?pageId=22676099
@@apm Thank you. I will try doing this.
Sleepy Joe in the beginning made me think that this is 2021 video :D
Which is better measure to use normalized residual error square or simple residual error square plz help
It is better to use normalized error square instead of simple residual error square when there is a large range of the magnitude of the values. The simple residual square error favors the larger numbers. The normalized fits a fraction that the number is off from the true value. An even better objective may be to use the normalized absolute value of the error, but this is generally more challenging for gradient-based optimizers.
How can you calculate the R^2 for this fitting?
Use the RSQ function support.microsoft.com/en-us/office/rsq-function-d7161715-250d-4a01-b80d-a8364f2be08f
Hello, can anyone explain me how can I use the polymonial regression equation to find the unknown concentration
hamza alati, once you create your correlation with parameters adjusted to match the data, you can create predictions of outputs with specified inputs. Please see Python material (or the Excel link) for additional tools for regression: apmonitor.com/che263/index.php/Main/PythonDataRegression
I will look for it because I spent my time on this but I have not understand it, thanks I will ask you if I did not understand it. Thanks you
I have got this equation from the polynomial regression Y=3E-10x4 -5E-07x3 +0.0003x2 -0.0401x+2.5901 , so what does mean E here please, I used it like this but actually I am not sure ((3*10^-10)*(B72)^4-(5*10^-7*(B72)^3+(0.0003)*(B72)^2-(0.0401)*(B72)+(2.5901))) AS E here 3*10^-10
Hello. How can i find the formula between the x and y? I have the values for x and y, but i don't know which is the dependence between them. I do know that it is a nonlinear one. Thank you!
If you don't know a form that you'd like to use, I recommend creating a scatter plot with your data. When you have the plot, right click on the data on the plot and select "Add trendline..." This will allow you to investigate linear, exponential, logarithmic, or polynomial models. Once you have an idea of the equation that you'd like to use, you can either stick with the trend line that Microsoft provides or else use this tutorial to have a more general form.
Thank you for the reply.
At the beginning of the tutorial there is the relationship between x and y. I am talking about this formula, I do not have it, there are only x and y values. I am trying to explore ”Add trendline....” and related issues in Excel.
After you explore different trendlines, you can also try different correlations. A common way to evaluate the "goodness" of the fit is to use the R^2 statistic. The closer it is to 1, the better the fit (in general). You can calculate the R^2 value in Excel with the =RSQ(X,Y) function. In this case, the X and Y are not the X and Y from your data but are X=predicted y(x) values from your correlation and Y=y values from your data.
Thank you very much for your answers. I already understood your tutorial and now I'm trying to see how to find the best possible correlation.
but that works only for linear regression, how about if we are having multi independent variables and a dependent one.How we can obtain equation using excel then?
Is there a reason you use a normalized error squared and not just squared difference?
+Pearsonificationable, a normalized version can help for estimation problems where there is a large difference in magnitudes of the measured values. Without normalization, the fit would preferentially favor reduction of larger differences that would typically be found at high values. The objective function depends on the specific goals of the optimization problem. See apmonitor.com/me575 for more details.
Thanks for the quick reply!
That was my impression, but I couldn't find a resource to articulate why. Most of the other examples I could find simply use a squared difference. And thanks for the link. The course info is really excellent. I hope I never have to go through ChE undergrad again, but if I do, I hope it's in your course.
Hi! Can we get some coefficient like R2 in order to evaluate how closely two non-linear sets are?
After 8:19 in the video you can evaluate =RSQ(C10:C29,D10:D29). The RSQ function will give you the R2 metric for your fit with input arguments as measured and predicted values. It doesn't matter which order you put them into the RSQ function.
I cnt understand where we find actual and estimate value
They are two columns in the workbook
What about if you do not know the base equation? You test one-by-one?
Yes, or use machine learning: apmonitor.github.io/data_science
Dear all,how did you solve this equation that is ln x = A + B/(T/K) + C ln(T/K) with microsoft excel. In this equation x stands for mole fraction fraction, A , B and C are model constants (unknown to us) and T is temperature in Kelvin.
The mole fraction solubility is determined at different temperature. i know that linear equation is work for determination of two parameters like A and B in equation ln x = A/(T/K) + B. But how did you get three model constants like A, B and C in microsoft excel?
+Pavan Rathi, you should just replace the equation in this example problem with yours. You can generally have any nonlinear equation or equations. You can set up a sum of squared errors and use solver to minimize the difference between model and measured values. Your problem is actually linear in the parameter space so it should solve quickly.
Sir, Thank you very much for your reply. I shall be thankful if you could explain with example
You just need to rearrange your equation as x = exp(A + B/(T/K) + C ln(T/K)) and use that to create your predicted values column.
Dear Sir, if we want to plot a graph between mole fraction solubility (X)and temperature (T in kelvin). What should be the X-axis? whether it is 1/T or lnT? Then how will you get the values of A, B and C from that graph?
The x-axis should be "T". You may be thinking about how to create a linear regression by performing a translation of the dependent variable. In this case, you have both 1/T and ln(T).
how can i do multiple non linear regression on excel
Just add new parameters and include those in the equation. You can also try a tool such as Python: apmonitor.com/me575/index.php/Main/NonlinearRegression Here is a linear regression example for comparison: apmonitor.com/me575/index.php/Main/LinearMultivariateRegression
So helpful! Thanks Sir. _/\_
например, у меня ряд значений (actual), как я могу сделать estimate?
Translated: "for example i have a range of values (actual), how can i make an estimate?". Here is additional help on regression in Excel: apmonitor.com/che263/index.php/Main/ExcelDataRegression and Python: apmonitor.com/che263/index.php/Main/PythonDataRegression If you have a range then an l1-norm is a possible solution for fitting between a range: apmonitor.com/do/index.php/Main/EstimatorObjective
Sir from where we got these actual values for constants?
They are initial guesses that are then optimized to have the model fit the measurements.
@@apm
Thank you sir
These optimized values obtained by excel solver?
@@garimadixit8536 yes, that is correct.
How did he get actual a,b, c
The values are listed as cells in the sheet.
how we get actual and estimated0.50,2.0 and 1.5
They are just guess values. You sometimes need to just try a few values until it gets close. Other problems are very easy and you can put all 1's or 0's for the guess values.
@@apm thank you very much...most useful video sir
just kidding! great video
Why did you normalise the error? Sum of squared errors would be the usual approach.
Both approaches are good. If you have a large difference in magnitude between values you're trying to fit then the higher values may be weighted disproportionately high because they may have a larger absolute difference that is squared. By including the normalization it is possible to equally weight all of the points based on a fractional difference
@@apm I think it would be better to use ordinary least squares, unless your data are across multiple orders of magnitude. Using relative errors causes problems when the values are near zero.
make video for xy=c, where c is constant
Same steps apply here, just change the equation.
what about google sheets can u doo dis
No, this isn't available in Google Sheets. There isn't a nonlinear solver such as a the Excel solver add-in. If you want a regression package that is freely available see this tutorial on Python: apmonitor.com/che263/index.php/Main/PythonDataRegression
That formula is a linear regression problem. Please change the title of your video.
You are correct that it is a linear regression problem with respect to the unknown parameters. I'm using a linear regression example to demonstrate a nonlinear regression tool. Some tools only do linear regression. Here is a more in-depth tutorial on linear regression: apmonitor.com/me575/index.php/Main/LinearMultivariateRegression and nonlinear regression: apmonitor.com/me575/index.php/Main/NonlinearRegression
hahaha.
you don't even explain what those $ signs are
The $ signs are to make the reference static so that the cells can be copied without changing the reference. This is one of many videos in the course. The introductory material covers items such as the $ signs. If you'd like to see all of the course content, please visit apmonitor.com/che263
Sleepy Joe in the beginning made me think that this is 2021 video :D
I cnt understand where we find actual and estimate value
Two columns in the workbook