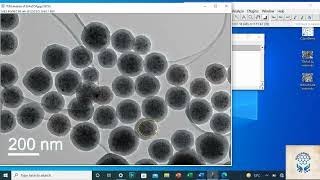
Measuring average particle size (histogram) from SEM image by ImageJ and Origin software

Вставка
- Опубліковано 5 жов 2024
- particle size,particle size distribution,particle size distribution curve,particle size analysis,grain size,origin,crystallite size origin,nanoparticle size,particles size,measuring average particle size,imagej particle size analysis,crystallite size,how to calculate crystallite size using origin,particle size calculator,average particle size,particle size vs grain size,particle,measure the particle size,sem particle size analysis
imagej,imagej software,imagej tutorial,image,imagej measure,image processing,imagej analysis,image j,imagej thresolding,how to use imagej,image j software,sem imagej,grain size imagej,imagej length,imagej image processing,image automation in imagej,sem image,imagej image analysis,image processing with imagej fiji,sem image analysis imagej,image analysis,free download the image j,imagej quantification images,imagej2,threshold in imagej


How do you keep the yellow line in all the particles? to not repeat particles ?
Can you mention your questions more specifically? Please mention the minutes and seconds so that I can answer correctly
How to keep the yellow line preserved in the particles in the video, it started from 3.19 minutes to 5.19 minutes
@@hadjiraraf1461 Once you have determined the diameter of a nanoparticle, you simply press "M" on your computer keyboard. The yellow line will keep automatically on the image.
Ctrl + t and select Labels
Please make a video on Fiji image J to calculate D10, D50 and D90 of a particle.
ok. thanks so much for the suggestion given. I will make it in the next video
It's a request to make the video as early as possible@@berbagipengetahuan7323