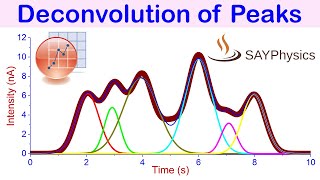
Deconvolution of photoluminescence PL spectra (peaks fitting) - 22

Вставка
- Опубліковано 9 лют 2025
- In this video, I have shown deconvolution of photoluminescence (PL) spectra i.e. PL peaks fitting using OriginLab software. After deconvolution, I label the peaks with wavelength and assign a color to each peak according to their emission band.
#NanoWorld
______________________________________
For more updates follow us on,
Facebook: / fascinatingnanoworld
Twitter: / nanoworld8
Instagram: / nanoworld85
Contact: fascinatingnanoworld@gmail.com
______________________________________
Interpretation of SAED pattern | estimation of d-spacing & (khl) values
• Interpretation of SAED...
How to put a scale bar on SEM & TEM images (SEM/TEM data analysis)
• How to put a scale bar...
No valid atomic position available (Rietveld refinement through X’pert Highscore)
• Fixing of valid atomic...
Negative intensities in scan data points (Rietveld refinement through X’pert Highscore)
• Fixing of Negative int...
Indexing XRD peaks with Miller indices (hkl) values using X’pert Highscore software
• Indexing XRD peaks wit...
How to plot JCPDS card with the XRD data using OriginLab software
• How to plot JCPDS card...
XRD data analysis using X’pert Highscore software
• XRD data analysis usin...
Deconvolution of photoluminescence PL spectra (PL peaks fitting)
• Deconvolution of photo...
How to find peak position and FWHM of XRD data
• How to find peak posit...
How to calculate crystallites (grain) size from XRD data?
• Crystallites (grain) s...
Estimation of grain size through modifies Scherrer equation
• Grain (crystallites) s...
Crystallites size and strain using W-H plot method
• crystallites (grain) s...
Calculation of nanoparticle size through SEM image
• nanoparticles size fro...
How to find Miller indices of XRD peaks?
• How to label XRD peaks...
How to calculate d-spacing from XRD data?
• How to calculate d-spa...
How to calculate lattice constant (a, b, c) values from the XRD data?
• How to calculate latti...
How to calculate microstrain and dislocation density from XRD data?
• strain and dislocation...
How to calculate crystallinity from XRD data?
• how to calculate cryst...
How to smooth XRD data?
• How to smooth data (XR...
Baseline correction for XRD data
• Baseline correction fo...
Cyclic Voltammetry Data Analysis
• CV Data Analysis throu...
How to find bandgap energy using the Tauc plot method?
• Video
How to calculate bandgap energy using the Kubelka Munk function?
• Bandgap energy using K...
Understanding Tauc plot, 1240 (constant) and 2.303 constant
• Band gap energy (Tauc ...
How to know a material either have direct or indirect bandgap energy?
• How to know a material...
DSC Data Analysis
• DSC Analysis Through O...
TGA Data Analysis
• TGA Analysis Through O...
How to plot the double Y-axis in a single graph?
• TGA & DSC double plot ...
Electron paramagnetic resonance (EPR) data analysis (calculation of g-factor)
• Electron paramagnetic ...
_________________________________________
Music Source Unconditionally by Broken Elegance 🎩 / brokenelegance Creative Commons - Attribution 3.0 Unported - CC BY 3.0 creativecommons.... Music promoted by Audio Library • Unconditionally - Brok...


Thank for useful guide. Please continue to make similar guidance in material characterisation. It make science more understanding, simple and available. Good luck.
Thank you, I will
Very nice explanation ❤
Should I do a baseline correction for the PL spectrum before deconvolution
Thank you very much sir.
I have a problem sir. In my PL data 2 peakes appear if zoom . Intensity difference is very high sir the small peak is not visible. How can I do the analysis sir. Please solve my problem sir
I have a doubt nanoworld.. Does the emmision colours are assigned with the wavelength value
Thank you🤘
Kindly make a video on how to plot TR-PL analysis as there is no perfect video on it. Thanks in advance!
Superb,ll try this right now!could you please upload videos on magnetic properties (VSM)of NPs in terms of their size , oxidation state etc.,
Nice work....Could you please explain for what reasons deconvolution is used?
did you got it?
@@jasiras.v.3698 Thank so much for the explanation ❤
Thanks..could you please tell me why some papers have both PL spectra(emission one) as well as PL excitation spectra at sone particular wavelength? What are the differences between them? Why particular excitation spectra is needed?
I think it is important to determine what is the suitable wavelength for excitation for the emission spectrum
Can u make ppt on design of experiments. How to use it.