Meta-analysis in Stata

Вставка
- Опубліковано 25 чер 2019
- Stata 16 introduces a new suite of commands for performing meta-analysis. Meta-analysis is a statistical technique for combining the results from several similar studies. The goal is to provide a single estimate of the effect of interest computed as the weighted average of the study-specific effect estimates.
In this video, Chuck demonstrates how to set up your data for meta-analysis in Stata,
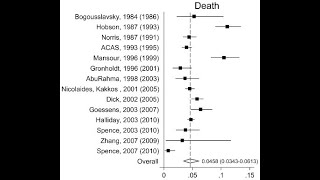
summarize meta-analysis data, and create forest plots and funnel plots. Additionally, he covers how to perform subgroup meta-analysis and meta-regression, and test for small-study effects.
www.stata.com


New to strata blown away by how much it can do. Thanks
Thank you very much, Chuck! =)
Great video. may I know why Random effect is the default option here. Thanks
Thanks!
You deserve thumbs-up!
Thank you How could I make sensitivity analysis in STATA?
Hi do you have a tutorial for completing a frequentist network meta analysis using Stata?
Dear, thanks for your impressive demonstration!
I have STATA version 14. I am working on systematic review and metal analysis on particular clinical data.
How could I analyze the pooled prevalence, forest plot, funnel plot using dialogue box menu?
Contact Technical Services at tech-support@stata.com. They should be able to assist you with this request. Another resource is to register to Statalist, The Stata Forum. It is a great place to discuss Stata and statistics. It is free to register at statalist.org.
Would you please show me how exactly you entered the data. I have metadata, but I do not know how to enter that, as yours is already pre-computed.
Hi !! This is much helpful !! Just a query : how can we add few other columns such as sample size or country in the funnel plot ?
Hello, I have the same problem. Have you found the solution? Is it possible to add the sample size when using this command?
how i can show p value on the graph or even calculate it in this examples !??
Thank you. Can the lower CI is negative? How this is interpreted against the principle?
in meta-analysis can OR be used instead of Log OR? and if yes how to have it ?
great trainings
kindly guide me in sensitivity analysis using stata, a video will be good. Thanks
How to cinduct meta-analysis of diagnostic test accuracy in Stata?
Excellent
Many thanks
Dear,
How can i set Meta-Analysis manually in STATA? Thanks in advanced
If you need to compute the effect sizes, you can use *meta esize* . You can type "help meta esize" in Stata and take a look at the examples. If you already have the effect sizes in your dataset, you can use *meta set* to declare the data to be meta-analysis data.
Hi, when I try to repeat this with my data, I get "variable _meta* not found" fot the Forest plot. What can be the reason?
Contact Technical Services at tech-support@stata.com with the commands you are running. We weren't able to reproduce this error message.
I am newer. So i want to how to input data for meta analysis
GREAT!!!!
Hi, Thanks a lot for this video. I would like to know the variables and organization of this variables in excel database, in order to import data and go to analysis in stata.
After loading any of the example datasets, such as *webuse pupiliq* or *webuse nsaidsset* you can click on the Data Editor icon to view the data in a spreadsheet format in Stata. Or, you can simply type *browse* to bring up the Data Editor. You'll notice that for meta analysis, we have one observation per study with variables recording the effect size, sample size, and other aspects of each study. Additionally, you can type *help import excel* to learn how to import data from Excel into Stata. Please email us at tech-support@stata.com if you have any other questions; we will be happy to help.
Hi, everything is great, but how to analyze data from one-way ANOVA for 3 groups? Could someone recommend a solution? Could I enter the effect sizes in "declare generic effect sizes"? For the entire ANOVA model it would be the Steiger's ψ (RMSSE) (???). Thanks.
If you have the standard errors for Steiger's psi, then you can use *meta set* . Generally, as long as you have the effect sizes and their standard errors you can use *meta set* to declare your meta-analysis data. Since you mentioned that you have three groups, and the official *meta* commands are designed for studies with two groups, you may want to consider the community-contributed network suite for network meta-analysis. Please type 'search network meta analysis' to learn more about these commands.
@@statacorp It is very helpful. Thank you very much.
Hi, why the funnel plot of fixed effect model in MH, and IV exactly are the same? I think the solid vertical line as the summary effect should be different but it is not
For the data set shown in the video, the overall log odds-ratio is 1.06 for the IV method and 1.09 for the MH, so the vertical lines are at different positions but it may be hard to see because the 2 values are pretty close.
@@javierzanet thank you so much
Very helpful. Can you please a video on how to enter data in strata for meta analysis?
To perform meta-analysis in Stata, your data should contain one observation (row) per study. You can type *help input* to learn about entering data directly into Stata. You can also type *help import* to get an overview of bringing data from several formats into Stata. Please email us at tech-support@stata.com if you have any other questions.
Why not use something like logistic regression to model this?
Hi! I work with Stata 14, and I'm trying to run a meta-analysis of Relative Risk Ratio, but I'm not being able to write the right command (not even for the RRR). Could you give some advice o recommend me some reading material? Thanks!
Our official suite of meta-analysis commands was introduced in Stata 16, but since you are working with Stata 14 you can take a look at the community-contributed meta-analysis commands that are available here: www.stata.com/support/faqs/statistics/meta-analysis/
@@statacorp Thanks! And in Stata 16 is it possible to run the meta-analysis for the RRR? I'm not sure which will be the appropriate command (I could only do it for the RR).
@@dafnecapelusnik3929 My understanding is that the terms *relative risk ratio* (RRR) and the *relative risk* or *risk ratio* (RR) are used interchangeably in the meta-analysis literature. In Stata 16, you can use the *meta esize* command with option *esize(lnrratio)* to compute the log risk-ratio (which is the same as the log relative risk-ratio), and then use command *meta summarize, rr* (option *rr* will display risk ratios as opposed to log(RR)) to obtain your results. I hope this helps!
@@javierzanet Thanks for answering! However RRR is actually the ratio between 2 RR, so I cannot replace for the RR command since I will have 8 variables to include instead of 4..
@@dafnecapelusnik3929 Please send your dataset to our Technical Services team at tech-support@stata.com and they will be happy to take a look and help you out.
How can I just get odd's ratio for effect size? I do not want log OR? thanks!
Hi, I was wondering the same? Have you gotten any response other than exp(logOR)?
@@iliasdoulamis8065 Stata 16 only gives the option for lnoratio, lnrratio, rdiff, or lnorpeto and any other resize() specification is invalid.
Whenever you want to present your results for example on a forest plot, you can use option *or* (or option *eform* ) to transform your effect sizes into odds ratios. The computation in meta-analysis happens on log scale for risk ratios and odds ratios. This is why Stata expect you to provide your data on log scale and this why the option name is *esize(lnoratio)* . But this fact will not prevent you from reporting odds ratios or risk ratios.
Dear Sir, could I require to ask a question? How could I combine the P-value of Meta-analysis in Stata 16? In Stata 12, I know that there is a P-value combined item. But the structure of Meta-analysis in Stata 16 has been changed. How should I accomplish that? thank you very much.
Hello, which command did you use to combine p-values in Stata 12?
@@javierzanet I want to combine the P-value of Meta-analysis in STATA 16. In Stata 12 it is obvious. Aber Stata 16 has a different interface in Meta-analysis. Could you operate it, Sir?
@@user-wi9zl5ur8o You have probably used a user-written command to combine p-values in Stata 12 (perhaps the *metap* command?). In any case, if you have Stata 16, you can email your dataset to Stata's tech support and let them know about the command you used in Stata 12, then they should be able to tell if you can replicate the analysis in Stata 16. Good luck!
@@javierzanet Thank you very much dear teacher H Assaad
Can this be used to pool proportional odds logistic regression odds ratio?
As long as you have the value of log(OR) (stored in a variable called *logor* ) and its standard error (stored in a variable called *se* ), you can use the following command *meta set logor se* and then perform any meta-analysis technique, like constructing a forest plot using command *meta forestplot* .
@@javierzanet Thank you. Just to check, is this the correct approach to use for meta-analysing ordinal data which has been analysed using proportional odds logistic regression?
please, who can help me here? There is no option for single group meta-analysis of proportions
Thank you for your question. Please contact Technical Services at tech-support@stata.com for details.
meta anaIysis pIugin doesnot come in my stata 15
First like Ü
Second like â
Thank you please would you drop your emails please?