Це відео не доступне.
Перепрошуємо.
Tutorial 24-Z Score Statistics Data Science

Вставка
- Опубліковано 18 сер 2024
- Please join as a member in my channel to get additional benefits like materials in Data Science, live streaming for Members and many more
/ @krishnaik06
Connect with me here:
Twitter: / krishnaik06
Facebook: / krishnaik06
instagram: / krishnaik06


@krish u explain way better than the PhD professors at University
Thanks
Do you understand what phd professors explain?
I was thinking the same when I was watching this. Nobody explained Z scores like this before.
Thx
Chutiyapaa,, nahi ata to kyun Padhate ho, future kharab kar raha hai tu
Hi Krish,
I really like your videos. Indeed you are doing a great work. This gives me motivation in my Data Science journey.
Just to put my thoughts regarding the probability calculation,
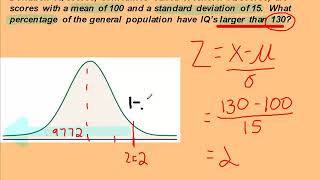
Total Area in the graph = 1+2+3 = 100
From the z score table we will get area 3 = 6.68
Now we are interested in 2+3 which we can get directly by 100-6.68 =93.32%
Thanks
Yes it works in this way also...
Nice explanation. It can also be calculated in simple way 1 - 0.0668 = 0.932
Yes, it should directly calculate 1 - 0.0668= 0.9320
Yes, 1-0.0668 = 0.0932
Yes 1-0.0668=0.0093
Sir , you have no idea how big a blessing you are ...thank you for your work!
Then oneday years laters, may be a decade later comes a guy like Krish and within less than 1 mins erases a doubt longer than 1 decade. You are a Guru, the true beholder of the sanskrit word of removing darkness and, in this case doubt.
You could have just substracted the value from the table from 1.0
Superbbb ...thanks for easy step
I cant explain my love towards you...love you for your efforts 🤩🤩
without that symmetry part, if we directly subtract that 6.68 percent from 100%, we would have an answer = 93.32%
I was gonna commenting the same
you all prolly dont care at all but does anybody know a tool to get back into an instagram account??
I stupidly lost the account password. I love any tips you can offer me
@Roy Marley instablaster ;)
@Gianni Marco thanks so much for your reply. I found the site on google and im in the hacking process atm.
Seems to take a while so I will reply here later when my account password hopefully is recovered.
@Gianni Marco It worked and I now got access to my account again. I'm so happy:D
Thanks so much you saved my account :D
hello krish sir , i actually studied about pdf in one of our btech subjects ,at that time i only knew how to find the answer to the question using z score table but never understood the real significance of that ,but today u made the concept clear and also its significance in real life .Thanks
Dude, you nailed it, I was just checking the resources to send to my younger cousin and ain't this the best when I know a thing or two in statistics! Great one!
Exactly what i needed... Thanks a lot
Thanku sir how simply you explain
Hi Krish,
just wanted to ask question at 9:07, why cant we directly do 100 - 6.68?
You can
yes, i think the same thing, i thing that give the same result, so it is applicable.
Nice explanation.... we can also get the answer by subtracting 6.68% - 100% ( = 93.32%) . As we don't require that 6.68%(students less than 60 marks) from our entire bell curve, we could just remove that 6.68% from our entire 100% bell curve. Correct me if I am wrong!
Yes we can
very very effective way to understand someone, god bless you sir
Hi Krish,
Could you please make a video on p test, anova, chi square test. How to use them and when to use what
perfectly explained! Thanks Krish naik
Best Explanation EVER! Hats off Man. !
Best explanation ever👌
Fantastic explanation. Thank you.
Great job. Your sincerity shows. Wonderful effort.
Playlist link : ua-cam.com/play/PLZoTAELRMXVPBTrWtJkn3wWQxZkmTXGwe.html
I salute to your teaching skill sir
Thank you for explaining why the z score is needed. Good going!
really its very interesting and I liked the way u taught....
Well Explained ..A Suggestion is if u has added more circumstance example such as one for right side distribution let’s say probability of getting > 90 it would be complete n comprehensive..v important concept 👏
Thanks for your time and effort.
@krish at this time interval 3:16, you have explained about z-score values. how did "μ" become 0? mean is 3 as we calculated. I didn't get this part. Can you please explain?
@Nandeesh mean didn't become 0 we forced the mean to be 0 by subtracting it from itself. We do this in order to convert the "Normal Distribution Curve" to "Standard Normal Distribution Curve". Standard Normal Distribution Curve has Mean = 0 and Standard deviation = 1.
For Example, if I have a sample with the normal distribution that has mean = 27 and standard deviation = 5 then to convert this we would subtract all the values in the sample from 27 (mean of the sample ) and divide by 5 (Standard Deviation of the sample) to standardize the curve.
I hope you I cleared your doubt.
could you please add machine learning example with z score.
Great explanation
wow the best explanation for Z score.
Here, it is considered data to be Gaussian or Normal Distribution and then converting it to Standard Normal Distribution (mean=0, std=1) by applying standardization or Z - score formula (x - xmean/ std). What if sample dataset is not a Gaussian or Normal Distribution, how to approach in those scenarios ?
Thank you for your great effort. BTW, when recording a video, a camera with fixed white balance and manual focus settings may help to improve quality.
Nicely explained
I think u are allowed to calculate the area by hands with series u can check it on wiki
sir p(x) will be 93.32 % as we have to plus the x and 50%(2nd portion) to find out p(x) > 60
Thank you for such a simplified explanation ❤️
Your a legend
Hey.
Really enjoying your videos.
This is lecture 24 but I can't find the other lectures.
Can you share the link to the playlist where I could find all the lectures?
TID
ua-cam.com/play/PLZoTAELRMXVPBTrWtJkn3wWQxZkmTXGwe.html you can find it here
Empirical formula( Central limit theorem) is wrong as per Chebyshev's theorem. And in practice we have to use Chebyshev's principle. I like your simplicity in explaining concepts
So basically through Z, we get to know the location of the pt, while through the z score table we get the area under the curve right?
Thank you sir for your simple and amazing explanation 😊
7:59 can't we do this-
1+2+3=100
So we can subtract 3 from 1+2+3 and get our percentage for 3
For random data can we apply the z score to convert it into the standard form so that it will give good accuracy? or the data must have gaussian distribution then only we can apply Z score? Actually I have to classify the images and for each image I have number of features which are random. can I apply z score to convert it into standard form?
Good explanation Krishna 👍👍
Sir plz make a paid course for data science for beginners like applied ai course
Already has a paid course
Second batch just started
@@tanviiyengar4146 which course youre talking about please tell I want to study statistics properly I am totally new to it.
nice explanation .I am calculating for P(z
what are the other reasons we use standard normal distribution apart from empirical limitation of normal/gaussian distribution
Thank you
Really useful videos. Why didn't you just subtract 0.0668 from 1 to get the probability?
I got A+ on my exam but I really never knew this much about Z Score.
Really Amazing Videos and efforts, Can you tell me please why i am not able to open your feature engineering playlist it says its private.
Why can't we use cdf to determine the probability ??
why not we directly subtract 100-6.68 than also get the answer
Thanku so much!
Sir, z-score stands for zadeh score right?
why dont we just subtract 6.68 percent from 100? that will straight away give us the answer?
i think this was not for the sample test right
Very Nice Video
Can't we also compute it by 1 - 0.0668 = 0.9332. Directly !
thankyou so much sir:-)
Superb
when you upload the AQI part-2 video....
Already uplaoded.If you are a member u will be able to see it
@@krishnaik06 sir if I take a 59 INR package can I see the all project video in one month
Please sir please upload AQI part 2 for us
@@nivitus9037 yes
why not to just subtract 0.0668 from 1...i.e 1-0.0668=0.9332
1 - 0.0668 = 0.9332 = ~0.94 .Easy.
Namaste Bhaiya Jee
respect
Hi Brother,
Just some addup..
You can set your Camera to manual focus, rather than auto focus, it is somewhat interference..
Sir i love your videos but this was too much big brain work to divide the normal curve into two parts and subtracting 50% + z score value to get right side area of the curve when we could have directly subtracted the z score value from 100% xD :v
Sir please make tutorial of web scraping complete
Can someone tell me how 0.0668 is calculated...?
z = x- u/s is fromula for z score what this z = (x-u)/(s/sqr(n)) is used for
when to apply z score to our data set
You can apply it when you want to find the probability of a variable taking a certain range of value. Ones you find the z score, you will be able to use the z score table.
They mad z score table to avoid calculating the integrals , 🙂
❤
🙏🙏🙏
Can someone explain difference between 59, 299 n 799 subscriptions plz....??
Its written below that, basically:
59 gives you data science material
299 gives you live QA session
799 gives you different kind of projects
@@someonesomebody716 thank you
❤❤❤❤❤❤❤❤❤❤❤❤
Sir don brabman
sir aap 100-6.68 hi kar lete