✋sir I wasn't going to but then I saw another video that is exactly what I needed to learn and I just want u to know that u have a new subscriber. And Do u teach physics only?
Thank you for watching and being a subscriber. So glad you found the videos helpful 👍🏾. Yes I only teach physics. Is there another subject you need help with?
Did you find this video helpful? 😁🔥 Click like 👍🏾✔and subscribe and click the 🔔 so you will never miss a video 🔥🔥. UA-cam.com/JuniorRoberts1 Thank you for watching 🙏🏾.
I have a practical test considering that tumorrow .l hope l will pass but without saying to much l would like to tell you that you are the best physics teacher in the world😚
Good day sir, please I need a confirmation on something, I was told in my senior year that line of best fit must pick at least 2-3 points but yours didn't pick any, so I'm confused
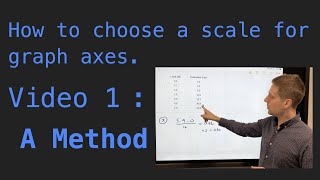
1)How to plot the graph of M against e? 2) measure the slope and explain its physical meaning. State the unit and estimate the error. 3) Did your graph pass through the origin? If not, give reasons. Deduced from your load(mass) extension, graph the weight Wa of the given object A.
Based on the scattering of the points the line of best fit may not be on all the points. You'll want to get as many points as possible on the line with an event distribution on both sides
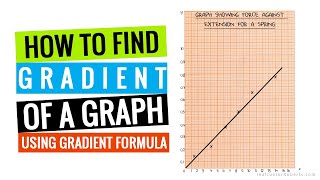
Yes it's possible. If the values on the x axis is larger than those on the y, you will get a decimal for the gradient. Ensure you also include the unit for your gradient
Sir! if we need to plot 31.8 on a scale of 1unit =5cm then how do we plot that point between 30 and 35? How to start counting from 30 onwards to find 31.8 between 30 and 35?
It would be slightly below the second small line after the line for 30. Each small line represents 1 based on the scale you used. I'm assuming the scale you used is 1 cm = 1 unit
Technically no. It all depends on how the points are scattered. The objective is to have an even distribution of points about the line of best fit. Thanks for watching
12:32 Why is it that you drew the broken lines above the 1.59 and not through it and you drew the vertical line at 0.75 instead of 0.7 on the x axis. Why didn't you draw the line through the last point?
Good observation. The reason why I drew the lines above 1.59 and .7 is to ensure that I get my points as far apart as possible. The line didn't go through the last point because the objective was to get the best fit line which shows and average of all the points plotted. Let me know that clears it up
Also when I am choosing my points I will tend to choose the most reasonable points that meet the criteria of being far apart and also not found in the table.
@@realJuniorRoberts Ok but why draw the second point above at 0.7 (y axis) but then draw the vertical line through the marked point at 0.1 on the x axis?
@@realJuniorRoberts ok, thank you so much Achievement unlocked: New Sibscriber!!! Point Earned: +1 This is an achievement that rewards the player when they gain a new sub. Now that you have been given this gift, it will be viewed by anyone who views your profile!
Once you have an equal distribution of points on both sides. When drawing best fit line it's best to use a clear ruler so you can see where the line would fall between the point
I’m in grade 7 and the y axis and x axis numbers are whole numbers but we are given decimals to put the points I honestly don’t understand and the teacher not explaining😭
Yes plotting decimals can be a bit challenging. When plotting decimals you can use whole number scales but have to be careful in identifying the values that you have to plot. This video should help you with plotting decimals. If you're still having challenges let me know


✋sir I wasn't going to but then I saw another video that is exactly what I needed to learn and I just want u to know that u have a new subscriber.
And
Do u teach physics only?
Thank you for watching and being a subscriber. So glad you found the videos helpful 👍🏾. Yes I only teach physics. Is there another subject you need help with?
@@realJuniorRoberts actually I'm not doing so good in physics or maths but physics is good enough for me.
@@tyeisrichards2987 okay great. What is your email address?
@@realJuniorRobertssir I still can't plot decimals on the graph . Please help me what should I do
Good evening sir please I can't see it clearly
Did you find this video helpful? 😁🔥 Click like 👍🏾✔and subscribe and click the 🔔 so you will never miss a video 🔥🔥. UA-cam.com/JuniorRoberts1 Thank you for watching 🙏🏾.
Thanks very much for this. I was given an assignment and your videos have given me great understanding in that assignment. One subscriber up next
Thank you for watching 🙏🏾
I have a practical test considering that tumorrow .l hope l will pass but without saying to much l would like to tell you that you are the best physics teacher in the world😚
Thanks a lot I appreciate it 🙏🏾. All the very best on your practical test👍🏾
Wow 😌, This is so nice sir please I need more videos sir,thank you sir
Thank u i understood cleary
You're welcome. Thanks for watching
Good bles you sir ...you have actually gain a follower ...AHH last last I learnt graph ... God bless you ok❤
Thanks. I really understand this now I hope I pass my exams
Thanks for watching 👍🏾. I'm glad this video was helpful. If you need any help with physics you can let me know
Good day sir,
please I need a confirmation on something, I was told in my senior year that line of best fit must pick at least 2-3 points but yours didn't pick any, so I'm confused
Interesting
Thank you for taking time to help.
You are welcome. Thank you for watching 🔥👍🏾. If they are any other videos you would like to see feel free to suggest them.
1)How to plot the graph of M against e?
2) measure the slope and explain its physical meaning.
State the unit and estimate the error.
3) Did your graph pass through the origin? If not, give reasons.
Deduced from your load(mass) extension, graph the weight Wa of the given object A.
Estimate the error in Wa.
I really enjoyed the video
Thank you for watching
Pls sir, is the line of best fit not supposed to be on the points
Based on the scattering of the points the line of best fit may not be on all the points. You'll want to get as many points as possible on the line with an event distribution on both sides
This video helps a lot.
Thank you Sir, you've earned a new subscriber.
Here from Knox College.
Thank you for watching
THANK YOU SOOO MUCH!!
You are most welcome. All the best 🔥
Sir can i ask??? What is the difference between 0.1 and 0.01 scale/ increment? Thank you
The difference between both is that one increases by 0.1 while the other increases by 0.01
@@realJuniorRoberts Thank you sir God bless
@@jaybheart9767 you are most welcome. If you have other questions you could let me know
Good job❤ very helpful
Sir, what if we are told to plot 4.98,4.95,4.96 , 5.03,5.06,5.09 as such ? How should I take the scale ?
Could you send the entire data set you have to plot?
Hi, I tried to construct the graph my self and my gradient is 0.057. Is it possible for your gradient to be 0. something?
Yes it's possible. If the values on the x axis is larger than those on the y, you will get a decimal for the gradient. Ensure you also include the unit for your gradient
@@realJuniorRoberts ok thanks so much
Sir! if we need to plot 31.8 on a scale of 1unit =5cm then how do we plot that point between 30 and 35? How to start counting from 30 onwards to find 31.8 between 30 and 35?
It would be slightly below the second small line after the line for 30. Each small line represents 1 based on the scale you used. I'm assuming the scale you used is 1 cm = 1 unit
Thanks for helping me out sir
@@jayaneepanchal1614 you are most welcome 🙏🏾
So, the line of bestfit doesn't have to go through a point?
Technically no. It all depends on how the points are scattered. The objective is to have an even distribution of points about the line of best fit. Thanks for watching
Is there a systematic mathematical formula to calculate scale. I have a hard time guessing. Any help is appreciated
Yes there is a systematic approach. Watch this video for help ua-cam.com/video/CYnVesLm8vo/v-deo.html. Thank you for watching 🙏🏾🔥
Sir please what does 2cm to rep 1unit in a graph means?
Each bold block measures 1cm so in this example it means that for each two bold blocks the scale on the axis increment by 1 unit
Let me know if that helps
12:32 Why is it that you drew the broken lines above the 1.59 and not through it and you drew the vertical line at 0.75 instead of 0.7 on the x axis. Why didn't you draw the line through the last point?
Good observation. The reason why I drew the lines above 1.59 and .7 is to ensure that I get my points as far apart as possible. The line didn't go through the last point because the objective was to get the best fit line which shows and average of all the points plotted. Let me know that clears it up
Also when I am choosing my points I will tend to choose the most reasonable points that meet the criteria of being far apart and also not found in the table.
@@realJuniorRoberts Ok but why draw the second point above at 0.7 (y axis) but then draw the vertical line through the marked point at 0.1 on the x axis?
Why not put it at 0.7y, 0.05x?
@@Kris_413 again to keep the points far apart and also choosing that point was quite easy to read off from the line
Csn you choose anywhere to be your gradient
Yes you can use points anywhere on the best fit line. Ensure they are far apart and does not correspond with plotted points
@@realJuniorRoberts ok, thank you so much
Achievement unlocked: New Sibscriber!!!
Point Earned: +1
This is an achievement that rewards the player when they gain a new sub. Now that you have been given this gift, it will be viewed by anyone who views your profile!
How to do 80 y and x axis 75.0 how do you find the scale
What's. The range of values for x and y axes?
Greatttt🇵🇰🇵🇰🇵🇰🇵🇰
Nice video ❤
Please sir can I send you my own table of values
Yes you can
@@realJuniorRoberts sir I think WhatsApp would be best to send it 🙏
@@emmanuelonyedire8785 876 286 5949
Sir what if you are plotting 0.10 till the end value and 0.3,0.5,0.9,1.20 and 1.50 how will that be sir
You'd be able to plot those using the same approach seen in the video. If you need further clarification you could let me know
@@realJuniorRoberts yeah sir I need more clarification
@@confidencechi39 send me a message 8762865949
@@realJuniorRoberts on WhatsApp sir ??
@@confidencechi39 yes whatsapp
Nice🙂🙂😄
Thank you for watching
I did everything correct but i have a different gradient. I drew my gradient lines smaller than yours. My gradient is 0.03
How to find a scale of graph with decimals and with three significant figures in the decimal. Pls I need the reply immediately
Nice one sir
But how I DM you?
Dm me at 876-286-5949
Sir can I send my own table
Yes you can. Send to realroberts.junior@gmail.com
How to draw the line ? How to know where the average of the point?
Once you have an equal distribution of points on both sides. When drawing best fit line it's best to use a clear ruler so you can see where the line would fall between the point
Please I'm having values and I can't plot them
What values are you plotting?
find the b of
Y=mx+b
0.54
I’m in grade 7 and the y axis and x axis numbers are whole numbers but we are given decimals to put the points I honestly don’t understand and the teacher not explaining😭
Yes plotting decimals can be a bit challenging. When plotting decimals you can use whole number scales but have to be careful in identifying the values that you have to plot. This video should help you with plotting decimals. If you're still having challenges let me know
@@realJuniorRoberts ok thank you I will 😊
😃😃😃😃
Well this explains a lot 🤔 sorry I mean everything
Thanks for watching 🙏🏾 I'm happy you found this video helpful 🔥 Please consider subscribing to get access to my latest videos.
I don't get the understanding well
What you find most challenging with graphs?
Pls sir how can I dm u or better still chat u private
You could email me at realroberts.junior@gmail.com or WhatsApp 18762865949
I don't understand 🙏
What in particular you need help with understanding?