How to Highlight Min and Max Values in Power BI Visuals | Step-by-Step Guide | MiTutorials

Вставка
- Опубліковано 21 сер 2024
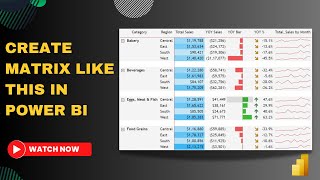
- Welcome to our Power BI tutorial! In this video, we'll show you how to highlight the minimum and maximum values in your Power BI visuals. Whether you're a beginner or looking to enhance your data visualization skills, this step-by-step guide will walk you through the process. We'll cover:
Setting up your data in Power BI
Creating a visual
Using DAX to identify min and max values
Applying conditional formatting to highlight these values
Don't forget to like, share, and subscribe for more Power BI tutorials and tips!
Download Dataset : 1drv.ms/f/s!Ar...
For Queries ✉ : MiTutorials08@outlook.com


Thanks for making this video.
Very helpful video
Very useful video 🎉🎉