You are one of the best teachers in Bangladesh রাশেদ ভাই শুধু মোটিবেশন আর রিডিং ভিডিও দিয়ে ভাইরাল হয়েছেন , আর আপনি কোয়ালিটি ভিডিও দিয়ে সবার মন জয় করেছেন।
Tumrar manushikotar somossa ase.tmrau asole real life ohonkari r pes lagaura.sobar bujanir style ak oile to duniyat sob soman oilo ona.r tui o gada thakle na ona.nije page khulle ona
The line chart illustrates the amount of carbon dioxide (co2) escape per person in four various countries the uk ,sweden ,italy and portugal from 1997 to 2007.
It is clear that the amount carbon dioxide increased in Portugal and Italy during the period from 1967 to 2007. In contrast, the United Kingdom and Sweden experienced a decline in Carbon emissions over the 40 year period.
kibabe apnke tnx janabo basa harailici❤.eto.helpful Video.😊 kibabe easily baiya guciye bollen😮 September 7 tarik amr exam baiya.ei video peye amr onek assist hoice..love you baiya❤ Anyway ami.amr fnd k apnr video Share korchi. Jate amr fnd o help😊
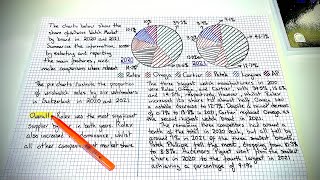
It is clear that the highest percentage of tourist visited in Provilon and pier in England during period of 1850 to 2010. In contrast, the Art gellery and festival experienced a decline in tourists turnout over the 30 years period.
Assalamualaikum😊 Sir afnar writing free club a gesilam for the first time tokon. Mehrab sir a line chart poraison ,ami asolei begginer jar karon a tokon buji nai ,,then bashat aiya afnar ow vedio dekar por a sobtah clear oise ,afnar pora r mehrab sir or pora onk clearly bujte fari ,,thank you sir amra student or lagi oto subidha koria Dewar lagi ,jajak allah kairan❤
brother this class super interesting .you tried to clarify all of the details as better as possible .To be honest, i god several sorts of information, which is really crucial .❤❤❤❤❤.
It is clear that the highest percentage of carbon dioxide emitted by each people in United Kingdom. By contrast, the proportion of carbon dioxide emitted by per person in portugal was lowest in the same year.
Overall, it is clear that production of carbon dioxide increased in Italy and Portugal during the period from 1967 t0 2007.In contrast, the United Kingdom and Sweden saw a decline in carbon emissions over the 40-year period.
The line graph compares the number of carbon dioxide emissions per person in four different countries. Duration changes over 70 years, starting from 1967 to 2007.
The line chart illustrates the emissions of Carbon dioxiad individual person in four different countries (Uk, Sweden, Italy and Portugal) thoughtout the period from 1967 to 2007.
The line charts provides information about the amount of average carbon dioxide emissions per person in UK,Sweden,Italy and portugal from 1967 and 2007,over a period 40 years. ❤ from Sylhet?
It is clear that ,the amount of eimitted co2 in Italy and portugal has increased gradually from 1967 to 2007, on the other hand the quantity of co2 in UK &Sweden is reduced in this 30 years
It is clear that, the Portugal and Italy carbon dioxide (co2) emissions increased durning the period from 1967 to 2007.In contrast, the uk and Sweden experienced a decline in carbon emissions over the 40 years period.
Sir..its really helpful...but could you tell me a best way that we easily recognize whether the subject is countable or uncountable? I faced a terrifying headache specially this😑
It is clear that the amount of co2 emitted each individual increased in italy and Portugal during the time period from 1967 to 2007.In contrast, the UK and Sweden experienced a decline in co2 emissions in the given years.
It is clear that the proportion of carbon dioxide slightly increased in Italy and Portugal from 1967 to 2007.In contrast, Between Uk and Sweden the number of carbon dioxide decreased over the four decades.
It is clear that the amount of carbon dioxied emission in Sweden and United kingdom were huge early in the period, but both of the country witnessed a decrese last time in the period. On the other hand, Italy and Portogul experienced a rais in carbon dioxaid emission thoughtout the period from 1967 to 2007, over the 4 decades.
The graph illustrates the data from four distinct countries in metric tonnes terms, where how much carbon dioxide (CO2) is emitted by individuals, spanning the period from 1967 to 2007. Overall, It can be seen that Portugal and Italy showed a high rate of carbon dioxide emission consistently throughout the years. In contrast, the UK and Sweden managed a decline rate in carbon dioxide emission in this period.
Overall, it can be seen that, though in the early age, the United Kingdom and Sweden had a great number of carbon dioxide emissions rates, they witnessed a decrease over the 40 years period. On the other hand, the average C02 thrown per person in Italy and Portugal increased gradually from 1967 to 2007.
It is clear that the amount of carbon dioxide increased in Portugal and Italy during the period 1967 to 2007. In contrast, the amount of carbon dioxide experienced a decrease in United Kingdom and Sweden over the period of 40 years.
The line graph compares the avarage amount of carbon dioxide emissions per person in four dufferent countries UK, Sweden , Italy and Portugal in the terms of metric tonnes, in over a period of 40 years till 2007.
The lince chart illustrates the amount of carbon dioxide emissions per person in UK,Sweden,Italy and Portugal from 1967 to 2007. Units are measured by metric tonnes.
Overall, it can be seen that the emissions of carbon dioxide increased in Portugal and Italy, whereas they decreased in United Kingdom and Sweden. Further, carbon dioxide emissions in United Kingdom were consistently the highest over the entire period.
The line graph compares the amount of carbom dioxide (CO2) emitted by each person in four different countries (UK,Sweden, Italy, Portugal between 1997 and 2007. It is clear that the amount of CO2 emissions increased in Italy and Portugal, durning the period from 1997 to 2007.Alternatively, in Uk and Sweden experienced a fall in carbon exhalations over the 40 years of period. In 1997, approximately 1 metric tonnes of carbon emitted in Portugal, While, the figure for Italy just over 4 metric tonnes.Over the following years, the amount of carbon emissions in Portugal increased dramatically to above 4 metric tonnes in 2007.Meanwhile, the amount of carbon emissions in Italy saw an increase close to 8 metric tonnes over the same period. Afterwards, the number of people who emitted carbon in UK decreased slightly from about 10 metric tonnes to 9 metric tonnes, a fall of 1 metric tonnes in 40 years.In 1997, Sweden was the third-most popular country, which peaked almost 10 metric tonnes in 1977.However, over the next 30 years, the amount of carbon emissions declined continuously to less than 5 metric tonnes in 2007, making it the least popular country of carbon emissions by the end of the period. Sir, if you don't mind, please check the answer and review it 🙏
At a glance, it is apparent that the production of carbondioxide in Italy and Portugal increased significantly,While in the UK and Sweden experienced a decilne in carbon emissions over the 40-year period.
It is clear that the carbon dioxide emitted per person on average increased in Italy and Portugal as well as metric tonnes was 1.5 to 4 during the period from 1967 to 2007. In contrast, the United Kingdom and Sweden per person emitted declined over the 70 years
The line chart compares the amount of carbon dioxide (Co2) which emissions each person in four different countries (Uk, Sweden,Italy and Portugal). Units are measured by metric tonnes.
It is clear that the amount of CO2 gas emitted per person in Italy and Portugal increased during the period from 1967 to 2007. By contrast, the UK and Sweden experienced a decline in CO2 emission turnout in the given years.
The line graph compares the amount of carbon dioxide (co2) by emitted per person in four different country ( England, Sweden, Italy, Portugal) from 1967 and 2007
Overall, the number of visitors to the pavilion and piers increased in brighton England during the period from 1980 to 2010. In contrast, the art gallery experienced a decline in visitors over the 30-year period. On the other hand, the art gallery remains plateaued in the given year from 1970 to 2010.
It is clear that the amount of carbon dioxide emited increased in Italy and Portugal durning the period of 1967 and 2007. By contract, the amount of Carbon dioxide emited was decreased in the uk and Sweden over the period of 40-year.
Overall .it is clear that the amount of carbon dioxide discharge by per person increased in Italy and Portugal. in contrast. The uk and Sweden experienced a dicline in emission co2 turnout over the 30 year period.
Sir khub icca cilo hexa's a apnr Course a join hobo but sei luck amr hoyni🥲 Alhamdulillah ekn ami most of time apr class gulu deki🥰 Line chart a subject r verb chinte ektu problem hoy....plzz assist me
The dynamic line chart demonstrates the amount of corbon dioxide emitted in four countries namely, United kingdom, Sweden,Italy and portugal in a period of 40 years strating from 1967.
The line graph illustrates information about the emission of carbon dioxide gas per human body over a-40-year period, starting 1967, in the UK, Sweden, Italy and Portugal.


![[UA] NAVI vs MOUZ | BO5 | IEM Rio 2024](http://i.ytimg.com/vi/CMBYk0cbGoA/mqdefault.jpg)


You are one of the best teachers in Bangladesh
রাশেদ ভাই শুধু মোটিবেশন আর রিডিং ভিডিও দিয়ে ভাইরাল হয়েছেন , আর আপনি কোয়ালিটি ভিডিও দিয়ে সবার মন জয় করেছেন।
Rashed vai mahir vaiyer boss
Tumrar manushikotar somossa ase.tmrau asole real life ohonkari r pes lagaura.sobar bujanir style ak oile to duniyat sob soman oilo ona.r tui o gada thakle na ona.nije page khulle ona
I agree your opinion...❤@@mdmoktarali9173
The line chart illustrates the amount of carbon dioxide (co2) escape per person in four various countries the uk ,sweden ,italy and portugal from 1997 to 2007.
আজকে দিনে আপনার লাইন চার্ট সার্চ করে পাই নাই,কিছুটা হতাশ হয়েছিলাম।তবে এখন পেয়ে ভালো লাগতেছে। ধন্যবাদ স্যার❤️
Mahir vai ami writing jno exam date pisaici but apnar ai video dekhe akn nije nije writing likte pari onk onk helpful ai videos gola
I am just astonished bhaiya. There are no teachers of IELTS as same as you
One of the best class i have ever seen about writing task 1.
Thanks a million Sir ❤❤❤
Thanks vaiya erokom ekta class upohar dewar lagi.
অনেক দিন ধরে আপনার এই ভিডিওটির অপেক্ষায় ছিলাম। অনেক অনেক ধন্যবাদ ভাইয়া❤️
It is clear that the amount carbon dioxide increased in Portugal and Italy during the period from 1967 to 2007. In contrast, the United Kingdom and Sweden experienced a decline in Carbon emissions over the 40 year period.
ভাইয়া আপনি আমার অনেক কনফিউশন দূর করে দিলেন... অসংখ্য ধন্যবাদ আপনাকে এইরকম ইনফরমেটিক ভিডিও বানানোর জন্যে!!
ধন্যবাদ স্যার এত সুন্দর করে বুঝিয়ে দেওয়ার জন্য। আশা করি সব সময় ভাল তাকবেন। ❤
kibabe apnke tnx janabo basa harailici❤.eto.helpful Video.😊 kibabe easily baiya guciye bollen😮
September 7 tarik amr exam baiya.ei video peye amr onek assist hoice..love you baiya❤
Anyway ami.amr fnd k apnr video Share korchi. Jate amr fnd o help😊
It is clear that the highest percentage of tourist visited in Provilon and pier in England during period of 1850 to 2010. In contrast, the Art gellery and festival experienced a decline in tourists turnout over the 30 years period.
সত্যি ভাই,আজ দারুন একটা ক্লাশ বুজে করলাম।সত্যি স্যার বুজানোর জন্য আপনি অসাধারণ।
Bhai and sir wow❤❤. Your sylheti boy right. I'm sylheti and I have completed my ielts two months ago at HEXA'S zindabazar. I'm Habigonj.
আপনার ভিডিও খুবই হেল্পফুল, টু দ্যা পয়েন্টে। একটা ভিডিও দেখলেই ওই টপিকে আর কনফিউশান থাকেনা। Bar chart, pie chart, table এর উপর ভিডিও দিবেন প্লিজ।
আসসালামু আলাইকুম ভাইয়া, আশা করছি আল্লাহর রহমতে ভালো আছেন। আমি রাইটিং মডিউল নিয়ে অনেক চিন্তিত ছিলাম, আপনার এই ভিডিও দেখে ১০০% চিন্তা মুক্ত হলাম আলহামদুলিল্লাহ। মহান আল্লাহ তায়ালা যেন আপনাকে সবসময় সুস্থ রাখেন ঈমানে, স্বাস্থ্যে, মস্তিষ্কে এবং মননে,, আমিন।
thanks vaiya..apni onek sundor kore sohoj kore bujhiye diyechen..😊❤
Very helpful..task 1 er sob video den as soon as possible my exam is coming soon
Best explanation. Respect sir❤
Assalamualaikum😊
Sir afnar writing free club a gesilam for the first time tokon. Mehrab sir a line chart poraison ,ami asolei begginer jar karon a tokon buji nai ,,then bashat aiya afnar ow vedio dekar por a sobtah clear oise ,afnar pora r mehrab sir or pora onk clearly bujte fari ,,thank you sir amra student or lagi oto subidha koria Dewar lagi ,jajak allah kairan❤
it was just mind blowing bro 😮keep it up
Onek valo laglo sir ❤. Onek help hoilo
সিলেট থেকে দেখছি Hexa's এর স্টুডেন্ট
এক কথায় অসাধারণ হয়েছে স্যার ,,,, অসংখ্য ধন্যবাদ
Hexas er course fee koto?
এখন ৬৯০০ চলছে অফারে মেবি
brother this class super interesting .you tried to clarify all of the details as better as possible .To be honest, i god several sorts of information, which is really crucial .❤❤❤❤❤.
ভাই এত সুন্দর ভাবে বুজছি,ভাবার বাহিরে।
It is clear that the highest percentage of carbon dioxide emitted by each people in United Kingdom. By contrast, the proportion of carbon dioxide emitted by per person in portugal was lowest in the same year.
Overall, it is clear that production of carbon dioxide increased in Italy and Portugal during the period from 1967 t0 2007.In contrast, the United Kingdom and Sweden saw a decline in carbon emissions over the 40-year period.
Best line chart video❤️❤️❤️❤️
best teacher from Comilla
Unfortunately you are an underrated IELTS teacher. Keep doing your good works. ❤
Sir apnar viewers maximum sylhety❤
Hm❤
Ammra hokkol Sylheti tai
@@mahfida Ji.sir sylhete ni
@@MUNTAHA-k6qJi Hexa’s zinbazar
Yes.. Bro
Thanks a lot sir apnr writing task 1 and 2 er vdo deikka onek concept clear oise take love ❤❤
The line chart compares the percentage of people who emitted co2 in the uk,sweden,italy and portugal from 1967 to 2007
Bhaiya thanks alot..I really don't think I need any other extra class for writing after watching all of your videos.. great work!!
Allhamdulillah body 1still bujechi,but 2 ta bujinai
The line graph compares the number of carbon dioxide emissions per person in four different countries. Duration changes over 70 years, starting from 1967 to 2007.
The number of হবে না
Really,You are a good instructor
Thank you sir.I think , writing task 1 line graph is very difficult but now it's easy for me. Because of when you Showed videos with this topic
Glad you’ve found the video useful ❤️
The line chart illustrates the emissions of Carbon dioxiad individual person in four different countries (Uk, Sweden, Italy and Portugal) thoughtout the period from 1967 to 2007.
The line charts provides information about the amount of average carbon dioxide emissions per person in UK,Sweden,Italy and portugal from 1967 and 2007,over a period 40 years.
❤ from Sylhet?
Over the 4 decades. likha jabe nah??
best lesson vai.
Wowww ur class is just amazing . Excellent presentation. I m soooooo pleased of ur class. 👌👌👌👌plz keep it up💜
It is clear that ,the amount of eimitted co2 in Italy and portugal has increased gradually from 1967 to 2007, on the other hand the quantity of co2 in UK &Sweden is reduced in this 30 years
It is clear that, the Portugal and Italy carbon dioxide (co2) emissions increased durning the period from 1967 to 2007.In contrast, the uk and Sweden experienced a decline in carbon emissions over the 40 years period.
You are the best for writing 💙
Sir..its really helpful...but could you tell me a best way that we easily recognize whether the subject is countable or uncountable? I faced a terrifying headache specially this😑
The graph chart compares the average production of co2 per head ,in four kinds of different states.
The Line chart illustrates the whole carbon dioxide (CO2) issue per people the UK, Sweden, Italy, and Portugal from 1967 to 2007
The line graph represents the percentage of visitor who visited various attraction in brighton England between 1980 and 2010.
It is clear that the amount of co2 emitted each individual increased in italy and Portugal during the time period from 1967 to 2007.In contrast, the UK and Sweden experienced a decline in co2 emissions in the given years.
Thanks a million. We need videos on Pie chart, Table and bar diagrams.
Please make the videos.
It is clear that the proportion of carbon dioxide slightly increased in Italy and Portugal from 1967 to 2007.In contrast, Between Uk and Sweden the number of carbon dioxide decreased over the four decades.
It is clear that the amount of carbon dioxied emission in Sweden and United kingdom were huge early in the period, but both of the country witnessed a decrese last time in the period. On the other hand, Italy and Portogul experienced a rais in carbon dioxaid emission thoughtout the period from 1967 to 2007, over the 4 decades.
We are waiting for your next Videos on Bar chat, Pie Chart, Table and advantage-disadvantage essay.
The graph illustrates the data from four distinct countries in metric tonnes terms, where how much carbon dioxide (CO2) is emitted by individuals, spanning the period from 1967 to 2007.
Overall, It can be seen that Portugal and Italy showed a high rate of carbon dioxide emission consistently throughout the years. In contrast, the UK and Sweden managed a decline rate in carbon dioxide emission in this period.
Overall, it can be seen that, though in the early age, the United Kingdom and Sweden had a great number of carbon dioxide emissions rates, they witnessed a decrease over the 40 years period. On the other hand, the average C02 thrown per person in Italy and Portugal increased gradually from 1967 to 2007.
Kon module diye age shuru korle better???
like should i follow any strategy in module?
or i can start w one of these
The line chart provides the emission of co2 per person in uk, Sydney,Italy ,Portugal over a period of 40 years
It is clear that the amount of carbon dioxide increased in Portugal and Italy during the period 1967 to 2007. In contrast, the amount of carbon dioxide experienced a decrease in United Kingdom and Sweden over the period of 40 years.
Pic chart vdo den sir 2ek diner majeee.... Dela onk help hobe
it is clear that co2 emissions of uk and swden decreased, which Italy and Portugal increased over the period.
The line graph compares the amount of Carbon dioxide (Co2) emissions single person in four variety of countries between 1967 and 2007.
The line graph compares the avarage amount of carbon dioxide emissions per person in four dufferent countries UK, Sweden , Italy and Portugal in the terms of metric tonnes, in over a period of 40 years till 2007.
The lince chart illustrates the amount of carbon dioxide emissions per person in UK,Sweden,Italy and Portugal from 1967 to 2007. Units are measured by metric tonnes.
The line chart compares the amount of people who emitted carbon dioxide in the UK,Sweden,Italy and Portugal from 1967 to 2007
Wrong .they didn’t tell about number of people
Amount + People hoy na....
Number + people
Percentage + people
amount + Uncountable (energy, power, air and water so on)
Thank you very for nice explanation 🙏
Thanks vai ❤
The line chart compares the every person's average emissions of carbon dioxide in four individual countries from 1967 to 2007.
Is it okay?
@IELTS MAHIR vai, bar chat niya akta vedio korten jodi, khub helpful hoto..
I salute you boss ❤❤
Overall, it can be seen that the emissions of carbon dioxide increased in Portugal and Italy, whereas they decreased in United Kingdom and Sweden. Further, carbon dioxide emissions in United Kingdom were consistently the highest over the entire period.
please, provide some videos on bar and pie charts
The line graph compares the amount of carbom dioxide (CO2) emitted by each person in four different countries (UK,Sweden, Italy, Portugal between 1997 and 2007.
It is clear that the amount of CO2 emissions increased in Italy and Portugal, durning the period from 1997 to 2007.Alternatively, in Uk and Sweden experienced a fall in carbon exhalations over the 40 years of period.
In 1997, approximately 1 metric tonnes of carbon emitted in Portugal, While, the figure for Italy just over 4 metric tonnes.Over the following years, the amount of carbon emissions in Portugal increased dramatically to above 4 metric tonnes in 2007.Meanwhile, the amount of carbon emissions in Italy saw an increase close to 8 metric tonnes over the same period.
Afterwards, the number of people who emitted carbon in UK decreased slightly from about 10 metric tonnes to 9 metric tonnes, a fall of 1 metric tonnes in 40 years.In 1997, Sweden was the third-most popular country, which peaked almost 10 metric tonnes in 1977.However, over the next 30 years, the amount of carbon emissions declined continuously to less than 5 metric tonnes in 2007, making it the least popular country of carbon emissions by the end of the period.
Sir, if you don't mind, please check the answer and review it 🙏
5.5
@@amiruddinadiHow 5.5
take love bro, from my heart🫀
The line chart compares the average discharge of Co2 per person in four different countries between 1967 and 2007.
The line graph compares the emission of carbon dioxide per person between 1967 and 2007 in four different countries.
At a glance, it is apparent that the production of carbondioxide in Italy and Portugal increased significantly,While in the UK and Sweden experienced a decilne in carbon emissions over the 40-year period.
how to rite this type of hard paraphrase 😯😯😯
It is clear that the carbon dioxide emitted per person on average increased in Italy and Portugal as well as metric tonnes was 1.5 to 4 during the period from 1967 to 2007. In contrast, the United Kingdom and Sweden per person emitted declined over the 70 years
You are the best brother
Sir ....onek balo bujan apni ....kunu tulona hoy na ....onno teacher er satee ....atto balo bujan ....😊
The line chart illustrates the carbo dioxide outflow of every person in the Uk , Sweden, Italy,Portugal from the year 1967 to 2007.
The line chart compares the approximate values of carbondioxide discharge each person in four several countries between 1967 and 2007.
Assalamu Alaikum, vai.
Please make videos on bar chart, pie chart, table and advantage-disadvantage essay.
The line chart compares the amount of carbon dioxide (Co2) which emissions each person in four different countries (Uk, Sweden,Italy and Portugal). Units are measured by metric tonnes.
It is clear that the amount of CO2 gas emitted per person in Italy and Portugal increased during the period from 1967 to 2007. By contrast, the UK and Sweden experienced a decline in CO2 emission turnout in the given years.
The line graph compares the amount of carbon dioxide (co2) by emitted per person in four different country ( England, Sweden, Italy, Portugal) from 1967 and 2007
Overall, the number of visitors to the pavilion and piers increased in brighton England during the period from 1980 to 2010.
In contrast, the art gallery experienced a decline in visitors over the 30-year period. On the other hand, the art gallery remains plateaued in the given year from 1970 to 2010.
The graph provides average carbon dioxide emissions each person in four various countries namely UK,Sweden, Italy and portugal from 1967 to 2007.
It is clear that the amount of carbon dioxide emited increased in Italy and Portugal durning the period of 1967 and 2007. By contract, the amount of Carbon dioxide emited was decreased in the uk and Sweden over the period of 40-year.
The line chat compares the amount of co2, which was emitted by each individual in four various countries during the years of 1967 and 2006.
Overall .it is clear that the amount of carbon dioxide discharge by per person increased in Italy and Portugal. in contrast. The uk and Sweden experienced a dicline in emission co2 turnout over the 30 year period.
Love you Mahir Bhai 🥰❤️
Sir khub icca cilo hexa's a apnr Course a join hobo but sei luck amr hoyni🥲
Alhamdulillah ekn ami most of time apr class gulu deki🥰
Line chart a subject r verb chinte ektu problem hoy....plzz assist me
Amazing sir. ❤❤
The dynamic line chart demonstrates the amount of corbon dioxide emitted in four countries namely, United kingdom, Sweden,Italy and portugal in a period of 40 years strating from 1967.
The line graph illustrates average carbon dioxide (CO২) emissions per person in four variant countries from 1967 and 2007.
The graph illustrates how much co2 discharged by per person of 4 various countries from 1967 to 2007
The provided line graph gives information on the amount of carbon dioxide emitted per person in four various countries from 1967 to 2007.
the line chart illustrates and compares the average carbon dioxide emissions out put per capita in four Europe nations between 1967 and 2007
Outstanding❤❤❤
The line graph illustrates information about the emission of carbon dioxide gas per human body over a-40-year period, starting 1967, in the UK, Sweden, Italy and Portugal.