Perform ANOVA Post-Hoc Tests (Bonferroni Correction) In Excel

Вставка
- Опубліковано 8 лип 2024
- In this tutorial, I’m going to show you how to perform the Bonferroni correction in Excel following a significant one-way ANOVA resut. Performing post-hoc tests with the Bonferroni correction will determine where the group differences are.
VIDEO CHAPTERS
00:00 Intro
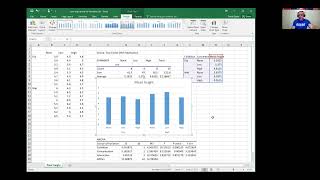
00:21 My example data
01:13 Performing T-tests
03:25 Bonferroni correction overview
04:41 Performing Bonferroni correction
05:27 Using the IF function
07:08 Interpreting the results
HOW I CREATED THIS TUTORIAL (AFFILIATE LINKS)
Screen recorder & editor techsmith.z6rjha.net/c/198849...
UA-cam SEO www.tubebuddy.com/SHTeach
Software (Microsoft Word 365 ProPlus)
FOLLOW US
Website toptipbio.com/
Facebook / toptipbio
Twitter / toptipbio
AFFILIATE DISCLAIMER
Some of the above links are affiliate links, meaning I will earn a commission if a sale is made after clicking on the link. - Навчання та стиль


these videos are some of the best tutorials on the internet. Thank you
Excellent video! Not only do you show how to do it simply, but now I understand HOW it works and why. Thank you!
I just stumbled upon this channel. I really appreciate the clarity of your explanations. These are topics that can easily be made obscure by disorganized explanations. You keep every simple, accurate and organized. Thank you for that
I am amazed at your simple yet logical conclusions drawn using simple tools available in EXCEL. Thanks again. I appreciate your teaching skills
Thank you so much for this video! It helped a great deal with my homework assignment! The textbook just wasn't doing it for me, but after hearing your explanation I got it completely!
One of the best videos I have ever seen. Thank you, Mr. Steven
Two years on and this video is still doing the Lords work 🎉❤
Haha glad it helped (multiple times)
you don't get enough credit for how well explained, well edited, and well presented your videos are. you put so much info in such a short amount of time it's amazing
Thanks mate. Appreciate that! Happy New Year!
extremely useful contents and great way to deliver.loved it.
love your content bro
Thank you Dr. Steven!!
SUBBED. Clear presentation and easy to follow guidance. Thanks!
You made my day! I was upset because I didn't know how to comment my data and you gave me a perfect way to do that! Thank you again
Very welcome
What a video. Thank you.
Good tutorial. Thank you
Thanks for the great series of videos!! really appreciate your efforts!!
Very welcome
Excellent !!
you are great. Thanks for this amazing video
you clearly explained it! tnx a lot!
very easily understood.
Thanks for Sharing such knowledge
you saving my life
You are awesome ❤️
You are a life savior!
Very welcome
I appreciate your very helpful and concise content!
Just a few questions, though:
1. If 2 of the groups turned out to be insignificant, and only 1 is significant, is the null hypotheses then considered? If so, are there any statistical tests to be applied next?
2. In the last slide, why is it that you used p
Awesome 😎
This was infinitely easier than the way my prof tortured us with
Wow
I've just found out excel is a great tool
IT'S SO USEFUL, THANK YOU
Hi, thank you for the video, why do you determine the p
i appreciate
Very useful and clear video ! Thank you :) to conclude, is it possible to say that Region 1 and 2 can be grouped under the letter A and the Region 3 under the letter B ? That way it would be possible to make a graph with the variable region on the x axis, the measurement on the y axis, add the mean value on an histogram shape and finaly add the letter A or B for each variable region ? This is the kind of graph that comes out when making an ANOVA with XLSTAT software.
Hi I didn't understand how you came to the conclusion. Is it based on the Mean?
Hi good day. This is useful. Where did you get the p
And also I have one doubt , I am having standard and test samples at 6 different concentrations I want to do statistical analysis which method can I do if one-way ANOVA means how to clearly do that can you please explain..
THIS VERY HELPFUL THANK YOU SO MUCH YOU REVIVE MY LIFE JDSFHDASFDS
I wish i could get an answer the B corrected is 0.01666..., why is it p
Thanks for the video! Why is the significance of the final result p
Alpha is just the theoretical value statisticians have chosen to compare to our actual p-value. If our p-value is less than .05, then we can reject the null hypothesis. This just means that we must be at least 95% certain that the data obtained is due to the independent variable, and not random chance.
it is because of Bonferroni adjustment. The new p value = 0.05/n.
Since we are doing three pairwise test, for each test we do compound alpha = probability of making a type I error = 1 - (0,95)^3
there is a high probability of having the test falsely significant, so we divide alpha by our number of pairwise tests.
Hi good day. This is useful. However why do you have p
I believe this is because the 0.001 is the alpha level used in testing rhe ANOVA and not the Bonferroni
Can you please do tukey's test pls..
at 3:38, what if one-way ANOVA test give you the p value greater than 0.05 (in my case I got 0.08 with my sample group)? How do you procedure Bonferroni correction? what is the alpha value then? can you just do same? Please let me know.... I desperately need your help
I don't know if my answer now will help you or not but the post hoc test are realizable only when one-way ANOVA test give you the p-value less than 0.05
I was following everything until the very end starting at 7:15 where everything was to come together and I didn't get how region 3 was significant. How did we reach that conclusion?
I don't know if this is still useful to you but:
Region 3 is significantly different because the p-value is smaller than the post-hoc-test alpha value when comparing against both region 1 and region 2.
hi, really useful but i keep getting value with 'e', like 4.37477E-07? i understand it means to the power of. is there an easy way of expressing this number please
Thanks Simon.
Sure. Right-click on the cell and select Format Cells. Change the category to Number. Then increase the decimal places to whatever is best for you.
Thanks!
@@StevenBradburn
ok thanks,
just tried it and i get 0.000000000000000000000000000000, could only go 30 decimal places
but when i select the cell is show 1.02902692632603E-100. Is the number just to small?
@@simonnash4321 yes
isn't it just like T test in general?
why it can be used as one way ANOVA post hoc?
do you have nay video on how to perform power analysis on ANOVA or beta analysis in excel ?
*any
@@kirangupta9170 hi Kiran. Not currently but I can looking into making one
@@StevenBradburn Thanks for the prompt response..I would anticipate it.
Excuse me for being nosey: are your from Yorkshire? If so I hope you are Leeds supporter rather than a Sheffied supporter.
Not nosey at all David. I'm actually from Manchester haha. Just not got that strong a Manc accent
@@StevenBradburn So either way you will be happy. (Unless you are from Salford I guess) I am going to refer my third year physiology students to several of your videos as guide to presenting and analysing their results
Sir may I ask po? I am confused, the (F(2,42)=23.409,p
That is the F statistic calculated by the test 😊