
- 118
- 677 391
GIS Solutions
United States
Приєднався 3 гру 2021
I'm passionate about GIS and finding solutions to geospatial challenges. I've been in the geospatial field for over 17 years in both the public and private sectors. In recent years, I've been a full-time GIS Consultant providing clients with unique solutions to make better business decisions. I hope you find value in these tutorials.
How to install SRTM directly into QGIS
In this tutorial, we'll go over the steps on how to install NASA EarthData SRTM directly into your QGIS Project.
Here are some useful links:
Creating and Styling Contour Lines in QGIS - ua-cam.com/video/E9noyMnDySw/v-deo.html
How to Generate Contour Lines - ua-cam.com/video/9KYktma-oHs/v-deo.html
Here are some useful links:
Creating and Styling Contour Lines in QGIS - ua-cam.com/video/E9noyMnDySw/v-deo.html
How to Generate Contour Lines - ua-cam.com/video/9KYktma-oHs/v-deo.html
Переглядів: 120
Відео
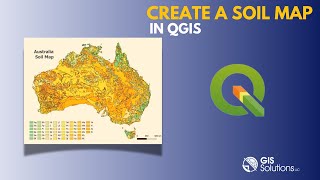

How to Create a Soil Map in QGIS
Переглядів 1,2 тис.Місяць тому
In this tutorial, we'll go over the steps on how to create a Soil Map using QGIS . Here are some useful links: FAO Soils Data - www.fao.org/soils-portal/data-hub/soil-maps-and-databases/faounesco-soil-map-of-the-world/en/ How to Add Additional Color Ramps to QGIS - ua-cam.com/video/WuEJGwFiBP8/v-deo.html

I asked ChatGPT to Create a Leaflet Map
Переглядів 3142 місяці тому
In this video, we'll go over the process of using ChatGPT to create some basic Leaflet JS code.

Exporting Symbolized + Labeled Shapefile to DXF in QGIS
Переглядів 7503 місяці тому
In this tutorial, we'll go over steps on how to symbolize and label a shapefile in QGIS then export it to a DXF CAD file.
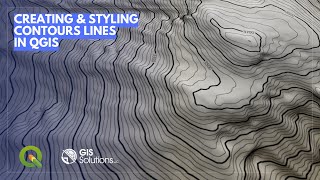
Creating and Styling Contour Lines in QGIS
Переглядів 4,5 тис.4 місяці тому
In this tutorial, we'll go over the process of creating and styling contour lines in QGIS. Here are a couple helpful recourses : Download DEM Raster Files Directly from OpenTopography.org - ua-cam.com/video/iNsRYPHw69c/v-deo.html How to Add Additional Color Ramps in QGIS - ua-cam.com/video/WuEJGwFiBP8/v-deo.html

How to download Topographic Maps using Google Earth Pro | US Army Topographic Maps | KMZ
Переглядів 1,1 тис.4 місяці тому
In this tutorial, we'll go over the steps on how to download Topographic Maps using the US Army Topographic Maps KMZ file in Google Earth Pro. Some useful links: US Army Topographic Maps KMZ file - maps.lib.utexas.edu/maps/topo/US_Army_maps_v_17.kmz Download Google Earth Pro - www.google.com/earth/about/versions/

QGIS intersect tool
Переглядів 2464 місяці тому
In this tutorial, we'll use the Intersect Tool in QGIS to determine the area overlapping 2 shapefiles. Helpful links: Add basemaps to a QGIS project - ua-cam.com/video/Z-u4AiDj6XA/v-deo.html How to add Open Street Map data to your QGIS Project - ua-cam.com/video/5-jIsIVeaA4/v-deo.html

How to Georeference an Image (PDF/JPEG) in QGIS
Переглядів 2,3 тис.7 місяців тому
In this tutorial we'll go over the steps on how to georeference an image in your QGIS map project. Some useful links: Library of Congress - www.loc.gov/collections/sanborn-maps/ QGIS Georeferencer documentation - docs.qgis.org/3.34/en/docs/user_manual/working_with_raster/georeferencer.html How to add OSM to QGIS - ua-cam.com/video/Z-u4AiDj6XA/v-deo.htmlsi=wl6rgd1fk0EV0_B7

How to merge multiple layers in ArcGIS Pro
Переглядів 1,4 тис.8 місяців тому
In this tutorial, we'll go over the steps on how to merge multiple layers in ArcGIS Pro. We'll also focus on aligning attribute fields where the field names are different.
Google Cities in Blender | Blender Blosm Add-on
Переглядів 74 тис.9 місяців тому
In this tutorial, we'll go over the steps on how to install the Blosm Add-on for Blender so that you can import Google Cities. The Blosm Add-on is a fantastic tool that eliminates the need of prior versions of Blender or the need for RenderDoc! You can download the Blosm Add-on for Blender here - prochitecture.gumroad.com/l/blender-osm
Clip Multiple Raster Datasets in QGIS
Переглядів 4429 місяців тому
In this tutorial, I'll demonstrate how to clip multiple raster datasets using the Semi-Automatic Classification Plugin in QGIS. This is a very robust plugin, but we'll just use the function to clip raster datasets based on a vector boundary.
State Highway Shields in ArcGIS Pro
Переглядів 1,4 тис.10 місяців тому
In this tutorial, we'll go over the steps on how to add State specific Highway Shields to your ArcGIS Pro map. Here are some useful links: GitHub State Highway Shields - github.com/VerdantSkys/DDVs_ALL Add Highway Signs to ArcGIS Pro - ua-cam.com/video/AAm9qIR4x6U/v-deo.html
QGIS Select Nearest Points
Переглядів 75311 місяців тому
In this tutorial, we'll go over the steps on how to select the nearest points in QGIS.
How to add WMS - Web Mapping Service to Leaflet
Переглядів 1,1 тис.11 місяців тому
In this tutorial, we'll go over the steps on how to add a WMS - Web Mapping Service to your Leaflet web map. Helpful links: WMS data used in demo - mesonet.agron.iastate.edu/ogc/ Create a basic webmap in Leaflet - ua-cam.com/video/xHmS4OpcEOc/v-deo.html
QGIS Download Dem directly from OpenTopography.org
Переглядів 1,9 тис.11 місяців тому
In this tutorial, I'll demonstrate how to download DEMs directly from OpenTopography.org into your QGIS project. This plugin requires that you have an API KEY from OpenTopography.org and I'll go over the steps on how to do that. Helpful links: Add basemaps to a QGIS project - ua-cam.com/video/Z-u4AiDj6XA/v-deo.html How to add additional color ramps to QGIS - ua-cam.com/video/WuEJGwFiBP8/v-deo.html
QGIS Create Time Series Animation
Переглядів 3,6 тис.11 місяців тому
QGIS Create Time Series Animation
Create a Webmap using the QGIS2web Plugin in QGIS
Переглядів 4,5 тис.Рік тому
Create a Webmap using the QGIS2web Plugin in QGIS
Leaflet Choropleth - How to create a Choropleth map in Leaflet
Переглядів 1,3 тис.Рік тому
Leaflet Choropleth - How to create a Choropleth map in Leaflet
How to change QGIS to Dark theme (Night Mapping)
Переглядів 967Рік тому
How to change QGIS to Dark theme (Night Mapping)
ArcGIS Pro Select By Location and Buffer Tools
Переглядів 1,3 тис.Рік тому
ArcGIS Pro Select By Location and Buffer Tools
How to Open ArcGIS Pro Files (gdb) in QGIS
Переглядів 4,6 тис.Рік тому
How to Open ArcGIS Pro Files (gdb) in QGIS
How to Add Additional Color Ramps to QGIS
Переглядів 2,2 тис.Рік тому
How to Add Additional Color Ramps to QGIS
Distance from Point to Nearest Line - in QGIS
Переглядів 9 тис.Рік тому
Distance from Point to Nearest Line - in QGIS
Can this plugin be used in China?
HELP! Everything works amazing BUT i can not export textures into FBX or OBJ file. Thank you!
awesome video simple and straightforward and everything was explained clearly! thank u so much!
Absolutely epic and really useful!
Thanks a lot sir!!!! Very coincise yet quite useful and worked completely. Thanks a lot again!!!!!
You are most welcome...thanks for the feedback!
I followed the same process you showed, but instead of using 1000 points, I used 30. However, I keep getting 210 points on my shapefile. Why is that?
Very good question and thanks for reaching out. Have you tried this process with a different polygon boundary? I'm trying to recreate the issue, but the results come back with the exact number of points I've specified. If you're still having issues and are willing to provide sample data, please email me.
This is the best video I have seen on UA-cam for making 3d models using Google data!!! You clearly explained all of the steps. Props to you!
Much appreciated, thanks for the feedback!
How would you go about to ask ChatGPT to create JS code to identify for example all houses with housenumber 613 in Dalles on a map? I have seen RainBolt do this but I can't pull it of.
Interesting question and I'm not successful on my end either. Perhaps you might have to be very specific in the data source being used to call out those house numbers. Please keep me posted!
Is it possible to apply this technique to the separate country, not island? It's easy to do when you have a sea around, but how to do this with a country with boundaries?
Great question and you're right, it's much easier having the landmass surrounded by water. Are you looking to 'elevate' the country and have the adjacent countries lower? Or are you separating out the country?
@gissolutions4604 I want to separate 1 country. I found only 1 option with touch terrain to do this. But need to draw manually the border in Google maps so it is or too long or too not precise. I cut everything in Blender at the end. But it is supposed to be easy way to do this using borders boundaries...
@@epelfeld I appreciate the follow-up and keeping me posted on your progress.
Hello! This is a kinda good tutorial, but I have a question, I need to model buildings that are not yet built, as a future project, is that possible to do in ArcsGis?
Yes, you can add those future project in ArcGIS Pro as a separate layer. You'll then need to extrude the features to 3D symbology. Hope that helps?
How can I get rid of the plane around the island?
Still having issues with the plane around the island? You might have to keep adjusting the 'strength' .
really useful plugin.
Thanks for the feedback, so glad it was helpful!
Thanks, great tutorial, I was struggling with various semi-working plugins without realising the temporal controller is now built-in.
Glad it helped!
Much appreciated!!
Appreciate the feedback!
Thanks for the tutorial! For anyone getting the 403 error: You need to enable the Google Maps Tiles in your API setting. I know you need to select it when you're setting up the whole thing but apparently that doesn't enable it.
Appreciate the feedback and heads up on the 403 error!
Do you have the list of acronyms?
They should be in the "Report" just above the link where you downloaded the Digital Soil Map of the World.
Thanks for this - brilliantly easy to follow and great process steps. One question - as I work mainly in Earth Pro - is there a way to bring the contour labels back to GEP as labels on the contour lines?
Thanks so much for the feedback and question. There's a QGIS Plugin called "Layer 2 KMZ" that'll allow you to export the vector layer with labels in a KMZ file that you can then use in GEP.
Thank you for a very clear and helpful tutorial! Blosm is a great tool and I am glad to add it to my workflow, thanks!
Thanks so much for the feedback and glad it worked for you!
What does it look like in the render view.....does GMS capture the materail and texture data???
Is there a possibility that I could do this without Google API Key. Im having trouble getting pass the billing stage.
Not if you want data from google
@@hello-qq7fh yep and also if I use other API its not the same luckily found an alternative instead. ua-cam.com/video/7YRusnTWXjw/v-deo.html
the real definition of "i have 75 alternative accounts"
Great I am an Architect took me 3 days to grasp. Thank you. Life Saver
Thanks so much for the feedback and so glad it was helpful!
Does it work offline
I don't believe so...
Awesome!!! Thank you, great content =)
I appreciate the feedback, so glad you liked it!
Thank you
You're welcome, thanks for the feedback!
I'm trying to do something very similar. I have pulled GIS data from my local gov and have Zip Code Boundaries which contains input fields: ZIP_CODE, Shape_Area, OBJECTID, and Shape_Length. I have a Current Land Use layer which I've set up rules to color code all the various land use types with input fields: LANDUSE, Shape.STArea(), OBJECTID, and Shape.STLength(). When I try to do the intersect like you did, it errors out saying the geometry the overylay layer has invalid geometry and to fix the geometry or change the "invalid features filtering" which I've done with no luck. What gives?
Thanks for reaching out. Yeah, I've come across this error as well. This link will help describe what's going on and how to resolve the error. There is also the "Fix Geometries" tool under Vector geometry>Fix geometries. Check them both out, hopefully they'll help? www.qgistutorials.com/en/docs/3/handling_invalid_geometries.html
3d tile gave me an 403 forbidden error...
Thanks for reaching out with this error. I did some investigation and hopefully the following steps will resolve the issue: In Blender, navigate to Scripting at the top menu, A View Console window should appear. Paste the following "C.scene.blosm.cacheJsonFiles = False", then press ENTER Apparently there are some changes with Google that's causing these errors. Please refer to this link for more info on this error - github.com/vvoovv/blosm/issues/443 Please let me know if this resolves the issue?
note: add arcgis feature service layer
it says "unable to process the root URL of the 3d tiles"
great explanation! thank you
Appreciate the feedback, so glad it was helpful!
Is there a way to make sure the curves don't cut out any of the points? So like make the curve stay on the outside of the points instead?
Great video, how do we enable turning layers on and off in the webmap?
I tried this on my merged layer (217 MB in size). When I tried to fix the geometry of my merged layer, it would just continue on & on. Please tell me how to run fix geometries on large files.
is there any way to change the params based on a user input?
How can I integrate the 30 minutes forecast? It should be free, isnt it?
too bad they deprecated that tool... BAD ESRI, BAD!!
How do you get the API key into the Google 3D tiles box in the blender addons in preferences cant get it in
You said, this is an extremely big file. You have no idea. It's now 2024 and the file is even bigger over 300 plus megabytes. But that's just the installation file. The total program is over a gigabyte. And guess what? It won't install on my Windows 10 computer. My computer holds a lot of disk space but not as much memory I guess as it's like going on 8 years old now. The requirements for RAM is 8 GB and I only have four on my entire computer so you're getting the drift I'm sure. So it would not install on my computer which is was extremely disappointing to me as this is not only a free usage app But also a great app I've read and I needed it to make my scenes for my videos and now I have to use alternate methods or video editors. 😒
maybe you can try to download the older versions of the app,
Thank you for sharing this useful, quick tutorial :)
Glad it was helpful!
Can you use this 3d model for commercial purpose ? As blender is free, but we are using google API. Is there any privacy policy, as we are not using cesium here.
It's a great question and I'm sure everyone's situation is different. If your business has a legal team, it would be a great question for them. Best of luck and thanks so much for reaching out.
Great video, my friend. This addon is wonderful. It does take my setup A LOT longer than yours for the google 3D tile map to download and propagate in my project. I've been waiting for over a half hour now to get about 5 blocks of Washington DC with the most detailed setting. lol I can see it's using like 3gb of memory and if I open the folder I set as the temporary download folder I can see the files pop up and then go away so it is definitely doing something. Just gotta be patient. Cheers!
Appreciate the feedback and yes, I can see that area around DC taking up quite a bit of memory!
Thanks...nice
You're welcome, thanks for the feedback!
very useful! Thanks a lot!
You're welcome! Thanks for the feedback.
I'm looking for an explanation on why QGIS processes contour lines differently when selecting meters vs feet (in the advanced tab). I tried both methods to create two different contour maps for comparison using the same input layer. One was in meters and the other was in feet with the interval being the exact multiplier (feet to meter). The contour maps were close but definitely different. Do you know why they would be different?
Interesting point...I'm not sure off hand, but will take a look into it.
How did you get Google Satellite on your QGis?
Please check out this video I did not too long ago about adding different basemaps to QGIS - ua-cam.com/video/Z-u4AiDj6XA/v-deo.html
The very first step, add a shapefile, doesnt appear as a button in my Google Earth Pro? It says add a polygon, but the window that pops up looks different
Oh, you're using QGis
Thanks!
Sure, thanks for the feedback!
I dontaed 1 thousand for dudes contribution to society
Hahaha, appreciate it my friend!
dOPE CHANNEL
Hi! Thank you for your video. Is there a way to find the nearest points but following a line (it would be streets in this case)
What a great question, however I'm not sure how or if it could be done. Please let me know if you find a solution.