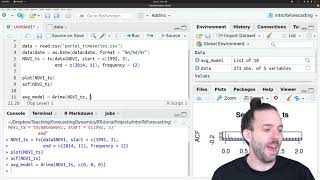
Time Series Analysis and Forecasting using ARIMA models in R

Вставка
- Опубліковано 17 вер 2024
- This R tutorial will help you understand the Basics of ARIMA Models in R. In this video, we will cover how to build a model from scratch. The ADF (Augmented Dickey-Fuller test) will be used to check the stationarity of the series. We will also use the PACF and ACF plots to identify the p and q term of the ARIMA Model.
Broad Topics are outlined below:
1/ Import Data/Change working Directory
2/ Covert Sales data into R time series object
3/ Check Stationarity
4/ Apply Differencing if not stationary
5/ Identify autoregressive term using PACF plot
6/ Identify moving average term using ACF plot
7/ Build ARIMA model using the arima() function
8/ Use forecast() function to forecast 12 months ahead
9/ Plot Time Series with Forecast
Code and Data Download: github.com/Kun...
#ARIMA #Forecasting #R #TimeSeriesAnalysis


Your video is the best explaination about ARIMA model so far in youtube, thanks for the information :)
Glad it was helpful!
This is all you need to grasp an idea of how to build an ARIMA model using R. No more, no less, great video.
Wow, thanks!
Great presentation: very clear and yet very informative, far from trivial.
Congratulations !
I just learned three weeks of work in 8 minutes. You can't beat expertise!! Thank you, Kunaal!!!
@kunaal, do you offer tutoring? I am a business analytics MS candidate, will need some help
Excellent lesson, I studied the whole semester but you explained it in 10 minutes
I am glad you found it useful :) I usually start by learning in the context in which it is applied and then learn the theory later.
Very nice explained but I did understand p value from ACF and q value from PACF plot for AR and MA respectively.
Very Impressive.. Alhamdulillah...thank u
This is a 😀😀great video for beginners like me!! Thank you
there is a lot of mistakes be careful
So well done. Thank you so much!
You're very welcome!
Nice explanation on ARIMA...
Thank you for Amazing explanation. I had a doubt regarding the forecasting step where the model was passed as paramter, but I read that the time series data can also be passed. Coukd you explain how that works. Thank you
Thank you so much
Nice one & Simple
I am glad you liked it!
@@KunaalNaik Yes Understood. Thanks. Looking for the same using Python from your end!
@@ravindrasinghs3014 Will work on a Video :)
Great video! I wonder if we would need to transform the predicted value, given our data has been differenced twice? If so, how can we do it in R?
Sir, I did the same steps, but my forecasted value is showing constant for upcoming years. How to solve this issue. Please guide
i am having the same issue
Thank you very much for the nice video that is so much helpful. Would you please explain the out put as the forecast results? What is really mean by Lo 80, Hi 80, Lo 95, Hi 95 and Point Forecast?
Those are just upper and lower ranges of the forecast.
Nicely explained but don't we get p value from ACF plot and q value from PACF plot for AR and MA respectively?
Can you explain more about how to determine the p and q values? I am not quite understanding. Thanks.
❤️❤️
It seems that the series contain seasonality as the coefficients for the MA part are significant for t=12,24,.... Could expand on this issue? Thank you.
Very good work! One question only. Does the ADF test you did recognizes that there is unit root? You mentioned only the stationarity problem. And if there is unit root how can we deal it?
You can try some other tests such as Elliott-Rothenberg-Stock Test, Schmidt-Phillips Test, Phillips-Perron (PP) Test and Zivot-Andrews test.
Thank you its amazing
I am glad you liked it :)
@@KunaalNaik I was not sure how to predict the p,d and q value but now I know with Akaike information we can know which is the best p d and q order to be set using R
@@KunaalNaik I am trying it for a secular trend i.e yearly, for this how shall I set the time in command?
@@rabinthapa9006 For d (stationarity test) p(pacf plot) and p (acf plot) This is the method used to select the p,d,q. Hope this helps.
@@rabinthapa9006 You can skip that argument if it's yearly.
Thank you for this. It's a really helpful tutorial. My ACF and PACF plots seem to follow the same distribution as yours. However, the scale of my lag axis is between 0 and 2. Do you know why this might be the case? I have a feeling its something to do with setting the frequency to 12 for the sales_ts variable that we did at the start.
Same problem here
Thank you!
The k value in the adf function refers to the number of lags to be used when calculating the test statistic. How do we know this is 12?
12 refers to monthly data. there is 12 months in one year.
what about 7 tells you it has a high significance to the model? the bar associated to 7 on the pacf looks unassuming compared to the other bars. How did you choose 7?
We can choose either 5,6 or 7. Went with 7 as is was the nearest and highest among the 3. We can choose others too. You want to check the MAPE. Choose the p which has the highest MAPE.
Hi, wondering why do we need check stationary so many times? The orginal, then the diff = 1, then diff = 2?
Feel like it is a stubborn way, once it is not stationary after testing the original, it should be regards as not stationary. We should stop but not so insist to prove that it is while it is not.
Sorry I am new :D
Can anyone help to explain?
By applying the diff = 1 or diff = 2, it will help the series to be stationary thus making the forecast reliable
Also, this tells you how far you should as far as differentiating in order to set the d parameter.
plus, If I am not mistaken, there is a function (ndiff?) which retrieves the best d in order to turn your series into a stationary one.
> emas_ts
The link you provided for code and data download is not working. can you pls help me ?
Here is the link for Data - github.com/KunaalNaik/YT_R_Shiny_Dashboards/tree/master/1%20Basic%20App
I'm having this error:
Error in UseMethod("forecast") : no applicable method for 'forecast' applied to an object of class "c('forecast_ARIMA', 'ARIMA', 'Arima')"
Please, do you know how to fix this?
Can you help me to illustrate the way to automatically select (p, d, f) quickly without having to go through each step of running ACF and PACF to choose?
I am afraid that won't be possible. We need to identify the parameters. You could try Auto Arima. However, it does not get it right often.
@@KunaalNaik Thank you Sir. However, can we use this model for multiple items at the same time?
@@phamvuquynhnhu2089 Do one model for one item at a time. This way the model is better interpretable.
@@KunaalNaik Thank you Sir for your support.
@@phamvuquynhnhu2089 Let me know how it goes or want to connect on your analysis. We could brainstorm together.
sir my project is crime forecasting
i use auto.arima code in r then my ARIMA model is (0,0,0)
so i confuse the forecasting
plz ans to me
I also face the same problem. If your problem is solved then please tell me how can I do??
For stationarity, do we not take the log of the time series values before differentiating?
do you have codes on arima for electric consumption
I don't have the directly. However, you can follow the method shown above. If it does not work try other methods such Holt's winter or ARIMAX.
if is it stationary then how can i get the "d" value???
Then d = 0 if the series is already Stationery :)
Why did you use the original data rather than the differenced data to fit the arima model ?
In the ARIMA (p,d,q) The "d" is the difference. It automatically does the differencing :)
Because differenced data is no longer the original data that needed to make forecast
Hello sir
My arima model order (1, 0,0) with non zero mean sir
What can i do
It is arima model are Ar model
Which sales data is it ,cananyone reply
I took this as sample. This is Sales of Milk :P
what if I have more than one product and data in days ?
Hi Dhanunjay, you can then build one model for each product. Also, days could used as a support to build models. However, it might be very volatile.
@@KunaalNaik thank you
when i use the auto arima function in my data, the adq value given "000". and when i forecast by this adq value(000) the next all years forecasting data given same. why the adq value given "000"?? and why the all future forecasting value is given same???
Avijit Auto Arima is not reliable in many cases. Do you want to connect and lets see the data together and figure what we can do?
Email me at fxexcel@gmail.com
@@KunaalNaik i just sent a mail in this id please check.
@@KunaalNaik sir, please check your email, i have sent a mail to you.
@@avijitghorai5535 Got your mail. let me check and get back to you.
@@KunaalNaik ok sir.. thank you
How about sarima sir
ARIMA does not handle the Seasonal Component well. It is always slower than the original seasonality. SARIMA help fix that.
Sir, please send me your email id??
kunaal@datasciencemasterminds.com
@@KunaalNaik sir please see your email. I have sent an email to you
Sir please check my email