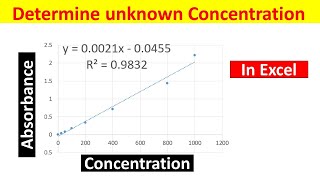
Excel Scatter Plot | How to calculate unknown value in graph | How to plot unknown in excel graph

Вставка
- Опубліковано 4 жов 2024
- An easy video explanation on how to plot a simple scatter chart to represent scientific data in Microsoft Excel. In the second video, learn how to calculate an unknown value in an Excel graph from a set of given data values, without manual extrapolation. Also learn to plot that unknown value on the graph in different colors. Learn Excel to simplify and hasten your work. Impress your fellow students and teachers. Specially made for research students and science students, who can use this trick in publications. Now everyone can learn Excel with these short videos. From Basics to Advance. Happy Learning !!
- Навчання та стиль


It was really helpful and what I was looking for. Thank you so much.
This was extremely helpful, thank you so much!
That was so helpful and straight to the point!
Thank you for the video! :)
You saved me from a breakdown thank you
Just what I’m looking for, thank you!
Thank you for your reply 😊
Thank you❤❤❤❤❤❤ it is very helpful
This is such an amazing tutorial thank you so much!!
Thank you so so much. This video is so Helpful♥️
THANK U QUEEN
very helpful Thank you
Amazing, this helped so much!
Thank you.It was so helpful
I have tried drawing graph, but on my excel sheet I do not found chart elements ,plus sign
So could not draw line and trend line
What to do?
Please help 🙏
I guess this must be an issue of different excel versions. What you can do is right click on the chart, and then select format chart. On the right hand side of screen, you will see a panel open, which will allow you to check the trendline option. Try it out. Lemme know.
Keep following
Hy, thnks alot. U really helped me out. God bless u
It's a pleasure and delight!!😍 Let me know in the comments if you need anything else.
It was helpful. Thanks.
Thank youuuuuuuu❤️❤️❤️❤️
This was very helpful, thank you :)
I feel like the answer it gives is always the linear trend line, how about if i wanted to find out the exponential trend line?
Hello Chamara,
It gives the linear trend line because we have clicked on the liner trend line option (which is also the default choice). For an exponential graph, you may choose the exponential trendline. All the best
thanks for handy skill. how will you find unknown absorbance for a given known concentration through formula plz.
Hey, the absorbance of an unknown solution is usually determined on photometer. So you don't have to calculate it separately.
If you still want to use it as a formula in excel, simply interchange the X and Y axis.
thanks for the help! :)
Thanks
Hi
If possible kindly advise on the below issue:
I want to put grade in Y axis instead of numbers. My grades are excellent, good and satisfactory, where excellent means 3, good means 2 and satisfactory means 1. I want to make a chart to show an employee’s progress of five years, like an employee got good in 1st year and excellent in third year and so on. Will this be possible?
It would be a great help. Thanks in advance.
Hi,
Sure you can do that. But then there's no need to follow this process because you'll already know employee performance. Simply, put your employee name, performance score and year. And plot a column or bar graph. Done. You can also email me at biowriter11@gmail.com for writing services.
What about we know ys value but dont know xs value?
Hey can you help me with a similar graph problem
Sure. Drop us an email
Can you do this with multiple points at once?
Yes you can
How? Plz reply me
The trendline command is not working and giving absurd value.
Hi Ashutosh, be careful while selecting the X and Y values in the trend formula. If you see my video, I have entered my X values in Y of the formula and vice versa. Give it another try. It should work in all formats of excel too. Let me know if you still need help
Is there any way to extrapolate a vertical line intercepting the x-axis from the unknown point?
I don't think there is such a procedure. But you can manually edit and draw a line. And then show the calculated value on the graph.
@@qASheducationcontent At first I did it manually but later I found the way.