Dude this is ANOTHER LEVEL! I've been doing simple excel dashboards and successfully impressed my employers, but this kind of dashboard is going to make their minds blown away! will absolutely try this in my next project. Thanks for sharing!
@@Arddy I was only developing simple dashboards with simple charts before stumbled upon this video. Now I managed to develop dashboards that look like professional websites. So, this method is obviously better than mine! 😄
I dont know how this came in to my recommended but I'm glad it did xD never knew excel sheets can become a piece of art...Looking like professionally designed analytics dashboards damm!
As a graphic designer with decades of experience in data visualization, I am very, very happy to have found this. I have a feeling I'll be using some of your templates in the future. :)
So I'm pretty good at excel. I use it daily as my primary tool for work and I must say - I am beyond blown away by how beautiful and impressive this is. It has opened my mind to a whole 'other level! I can't believe it! It's just so stunning! Going to be taking inspiration from this moving forward and definitely showing this video to others since it's so insanely genius!
I love how they allow you to purchase the template, but also give the tutorial if you want to learn or make it yourself for free (aside from the cost of excel of course). This is sure to impress employers, especially since they never think much of "proficient in excel" on applications.
Oh they do, but that "proficiency" amounts to knowing how to use pivot tables. This stuff right here will completely blow them off the face of the Earth.
@@BeyondTheIslands Yeah you're right, I've seen "proficiency in excel" among other microsoft office applications in under the job requirement for jobs that won't touch a goddamn computer. It's like the joke about having to reverse binary trees in an interview for a middle school IT position
No one is going to be impressed by this. This is pure fluff, there is zero interactivity with the data, you can't drill-down or segment it, it's style over any substance. Excel is meant for presenting data in as simple and impactful a way as possible, you would be laughed out of an interview at a corporate with this.
@@mdc123-v2v If Excel were just about data entry, there would be no need for any of it's functionality. The point of this dashboard is that it calculates the statistics from the data entry and displays them on a readable dashboard with graphs that display the importance of the information. More importantly, if shows that you clearly know your way around excel. Any employer who would laugh at this just because of the fluff should be fired
@@mdc123-v2v customers eat that shit up like it's froyo. Excel is meant for presenting data. Simple and impactful is just what you like. If excel was only about data, you'd easily do with a database engine instead.
I don’t know if you’ll read this. This video inspired me. I knew the possibilities of data representation in excel are unlimited but this…… This was a very unique and beautiful approach. Not only me but you must have inspired thousands if not millions. 🎉
let me say this clearly. the entire world financial markets rely on, depend on, and exist solely on MS excel. if they sent out a "nuke" command code via an update the worldwide economy would crash and we would have instant wars.
True, I was mind blown when I first discovered what can be done with PowerPoint, seeing the same being the case for Excel is just, wow. As a student, I guess it's time to learn some Excel.
Honestly, it's the OTHER LEVEL, your videos gave me a huge inspiration enhancing my creativity level personally, before watching your tutorials I thought I am good enough in excel! but after your videos, I realized there are much more you can do by connecting things together, It's not only the rigid knowledge of the app that takes you to the next level. It depends on how you can utilize it. Thanks for the priceless effort you made through all your videos whoever is behind this channel.
Honestly.... jaw on the floor in awe of this masterpiece. I can't believe this was done in excel. I watched the entire tutorial and I'm still in shock. This is absolutely insane...
So I'm pretty good at excel. I use it daily as my primary tool for work and I must say - I am beyond blown away by how beautiful and impressive this is. It has opened my mind to a whole 'other level! I can't believe it! It's just so stunning! Going to be taking inspiration from this moving forward and definitely showing this video to others since it's so insanely genius!
This is art. One tip: How about creating a base design and then duplicating the worksheets? Saves time in formatting other worksheets alike and copy-pasting similar elements.
@@OtherLevels wouldn't that be just crazy and so unique! You pull that off and if I were you then I would build a whole community around that and sell your excel-based games as NFTs! Imagine that!
@@rinnepy depends what you’re trying to use photoshop to do but since all images pasted within office programs are in layers you’d be surprised and how much you could do. Just would take a lot more time since it isn’t tailored for the use case. Being someone who likes to create original digital art within programs like photoshop though, there would be a lot lost due to not having the brush engine.
I Believe if @Other Levels and @One Skill PowerPoint work together, they can create an incredible system using PPT and Excel, Please think about it...for humanity
@@magnetoza It depends on different situations and circumstances. In finance, Excel is everywhere and known to pretty much everyone having to deal with numbers, for example. Even outside of finance, your dashboard may need to be given to senior management and other people not having the know how to use something more complicated. They may just want to browse the data and see quickly what things look like during the day. There is no need to give something more complicated to this user group. A more viable competitor may well be to use a backend service to calculate and then feed the data to some webpages, but then you have to deal with the infrastructure to hold the components as well as to support everything later. For a small business, it is less likely to do this.
This looks so amazing i'm commenting on it before i've watched it. You know this is the video everyone needs. You've come a long way, and i hope success sees you soon if not already.
When I first saw the beginning of this video I was thinking you would start using clipart to make the sections of the dashboard but to see that you do it all from within excel and it's available tools is pretty amazing. I knew excel was capable for making dashboards but I never knew it allowed this much detail. I've been using data studio and sheets for quite a while now and I would love to have this much functionality in my dashboard workflow. It's making me think if only excel was as accessible as sheets/bq and data studio cost and shareability then I probably wouldn't hesitate to switch. Mircrosoft just adds such a huge pricetag to everything. Anyway excellent video
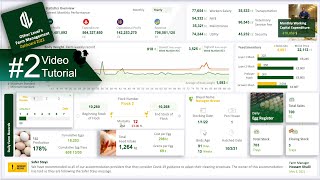
00:36 Financial statistics system with multiple dashboards using Excel 02:49 Setting up the first dashboard and its elements. 10:51 Creating a scatter chart with multiple shapes and charts for the financial statistics dashboard. 14:24 Creating financial statistics dashboard elements in Excel 20:33 Creating and analyzing income sources dashboard 31:32 Use circular symbols and design a distinctive background for financial statistics dashboards system. 43:39 Creating financial statistics dashboards in Excel 51:01 Design a creative financial statistics dashboard system Crafted by Merlin AI.
Thats quite amazing, I am used to making charts and visual aid fo projecks in Msexcel but the design was never on my strong side, I am sure to learn something very usefull from this tutorial.
The AI and Crypto Deck creators are going to have a Blast using this in their next sales deck and concept notes. This was an exceptional tutorial, Hope to see more themes of Styles to do in Excel, Maybe an Agency Model for Digital Marketing plan or Social Media content theme.
This is super cool - great work. My only critique of these types of dashboards, and I'm curious of your thoughts, is that if new data series are added (for example: a new method of Advertising, like say Magazine or instagram, etc) you need to manually go in and add that line item to the dashboard doughnut chart. I love these creative dashboards. But it is these exact type of limitations for why I can't hand them off to my boss or some other user - because it constantly needs my manual updating.
Couldn't you design basically a Form to fill say on a spare spreadsheet tab so that other users could add that needed info tap like an "add to charts" button and then script that updating so that any user could do those edits :)?
@@Aetheric I know with tables you can auto update lists at any time. Simple pivot references would auto update. However the scripting of the additional series to the dashboard custom charts, that's a bit technical for me.
We need more UI or I should say more GUI like this . I saw years ago this interface for music were the songs were clusters of little stars and the albums were galaxies ...It was beautiful.
@Other Level's.... from 11:00 mins of the video I have been trying out where and how did you get the data for X and Y to prepare the scatter chart. Not sure if I missed out anything on the video but I surely cannot find it anywhere.
Really nice dashboard. However, I think it doesnt fulfill the main goal of a financial dashboard: to be easily readable, with all consistent information in one page. Here, we have some basic information, that not allow anyone to take any action or explanation (where come the variance, ...). Anyway, Good job for the design and thanks for the sharing. Really appreciate it.
I was going to say the same thing. I did this type of work and information overload defeats the purpose of a DASHBOARD. Think of your cars dash board. If you had every metric possible on your cars dashboard it would take you forever to know if you're speeding or low on gas. A dash board should be simple in the data it provides as it should be the most critical pieces of data needed to make a decision. You should then build in sub sheets that allow you get additional detail for the metrics in question if needed, This is cool looking, but it's too much data for practical use.
@@ikannunaplays I agree with you and with @Galiat. I've been watching some videos of Other Level's and, yes, they are all great, good-looking dashboards to please our views. However, the more sophisticated the videos have become, the more information is necessary to fill in the dashboards, and it's getting hard to see such a lot of information spread on every corner. It should be kind of simple and easier. And the time spent seems to have increased in order to make them - due to the amount of information displayed.
@@cassioalexan I second you both. It has to be simple, easily acessible and clear. After many years using third part solutions, developing my own app, I came back to a very simple spreadsheet, actually using google docs (because it gets the prices from the market) and I think that's the best for me. Also, the only colours I use is to point negative values (in red) and some big distortions (i. e. price lower than patrimonial value in x% ). Other than that, plain white.
for my business I made a semi CRM software, on which I used some pre made dashboards (css and javascript) it was fun for a while, but later I realized I only rely on more basic reports. some info come on it's dahsboard, but I have to check it on a basic report
For a boardroom presentation with high level numbers, this is perfect and I cannot ask for more. It looks great and I am sure it will impress a lot of em. As a management account and business analyst, I’ll stick with my messy pivot charts and tables to easily manoeuvre the ever changing number game within a business.
Wow. I am gonna learn this immediately lol. I don't understand the X Y values and how they are numbered for the circle locations. Could someone please explain?
Hey, your work is just beyond amazing. I never knew that such an interactive and beautiful dashboard can be created in excel. Can you pls tell which excel version are you using ?
I'm feeling myself luckiest one on this planet after youtube recommend me this video. Now I don't know how it recommends me but I unconsciously clicked it and yeah it was my best decision ever. Now In Sha Allah it will progress my business by doing this art and yeah all of my employees would be rather astonished 😂😂
Amazing, I didn't even think you could do this with Excel...I haven't even seen anything like this being built on PowerPoint either. It would be really great if you could provide the dataset so that we can follow along with the tutorial, I'm already itching to start learning myself!
anyone ok with 44:00 how do you change it to combo, while keeping it as a circle. when I change mine to combo it's not a donut anymore - it changes to a square
This looks stunning. I'm in a sales role and would love something like this to share quarterly sales results. Is there anyway to integrate with Salesforce?
Uma obra de arte, sinceramente até me emocionei um pouco kk de tão bem feito e incrível, parabéns, te aconselho a estudar sobre como 'ranquear vídeos no UA-cam' te desejo tudo de bom e grandes conquistas, sucessos e abração =)
Great video. I started watching your videos last year as a beginner before giving stock market a trial. I was able to make $33,600 with a capital of $9,000 trading with an experience expert who guided me through out my trading.
What a CREATIVITY!!! You can find Macro's, Visual Basic's and C#'s traces everywhere.. but where are they :)) just need to know a little PivotTable and some basic formulas, and of course, have like this ART of IMAGINATION.. congrats..
This reminded me of the first time I watched a video of some guy drawing the Mona Lisa in the MS Paint with incredible detail. There will always be pro users who will just take things into the next level.


www.other-levels.com to download our Templates & Get Free Datasets
🤯
are we allowed to redo the same and post in our socials?
Even Microsoft in their wildest dreams wouldn't have pictured these possibilities in a thousand years
This is ART!
Shockingly awesome stuff can't imagine though
if i may ask what is this dashbord? Like what would it help with?
@@Jun_ljs Watching the video from the beginning would help 😉
i imagined this but had zero idea how tro make it
i made a pokemon game inside of powerpoint in like 2005. This stuff was always possible.
Dude this is ANOTHER LEVEL!
I've been doing simple excel dashboards and successfully impressed my employers, but this kind of dashboard is going to make their minds blown away! will absolutely try this in my next project. Thanks for sharing!
How did it go?
@@decisive5760 It's been great! Doing more dashboards for current employer and for SME as my side hustle 😄
@@aafifuddeen Would love to hear how it went for you! Pass us some key take aways using this method vs yours :)
Hi Ahmad, I want to create dashboard for my own finances and business. what would you suggest for beginner?
@@Arddy I was only developing simple dashboards with simple charts before stumbled upon this video. Now I managed to develop dashboards that look like professional websites.
So, this method is obviously better than mine! 😄
I dont know how this came in to my recommended but I'm glad it did xD never knew excel sheets can become a piece of art...Looking like professionally designed analytics dashboards damm!
Dear, really we appreciate your words and hope you enjoy our ideas
it is!
Same here...no clue :D
Lol same
ua-cam.com/video/mJfg-XJ7hK4/v-deo.html
As a graphic designer with decades of experience in data visualization, I am very, very happy to have found this. I have a feeling I'll be using some of your templates in the future. :)
So I'm pretty good at excel. I use it daily as my primary tool for work and I must say - I am beyond blown away by how beautiful and impressive this is. It has opened my mind to a whole 'other level! I can't believe it! It's just so stunning! Going to be taking inspiration from this moving forward and definitely showing this video to others since it's so insanely genius!
Glad it was helpful, Thanks dear @user-bq5et3fm5n
I love how they allow you to purchase the template, but also give the tutorial if you want to learn or make it yourself for free (aside from the cost of excel of course). This is sure to impress employers, especially since they never think much of "proficient in excel" on applications.
Oh they do, but that "proficiency" amounts to knowing how to use pivot tables. This stuff right here will completely blow them off the face of the Earth.
@@BeyondTheIslands Yeah you're right, I've seen "proficiency in excel" among other microsoft office applications in under the job requirement for jobs that won't touch a goddamn computer. It's like the joke about having to reverse binary trees in an interview for a middle school IT position
No one is going to be impressed by this. This is pure fluff, there is zero interactivity with the data, you can't drill-down or segment it, it's style over any substance. Excel is meant for presenting data in as simple and impactful a way as possible, you would be laughed out of an interview at a corporate with this.
@@mdc123-v2v If Excel were just about data entry, there would be no need for any of it's functionality. The point of this dashboard is that it calculates the statistics from the data entry and displays them on a readable dashboard with graphs that display the importance of the information. More importantly, if shows that you clearly know your way around excel. Any employer who would laugh at this just because of the fluff should be fired
@@mdc123-v2v customers eat that shit up like it's froyo.
Excel is meant for presenting data. Simple and impactful is just what you like.
If excel was only about data, you'd easily do with a database engine instead.
Until I saw these videos, It was like driving a Toyota Corolla for 20 years, then after seeing "Other Level's", I see a Ferrari in Excel." Great work!
I don’t know if you’ll read this. This video inspired me. I knew the possibilities of data representation in excel are unlimited but this…… This was a very unique and beautiful approach. Not only me but you must have inspired thousands if not millions. 🎉
Whoa. UA-cam has been absolutely killing it with its recommendations lately.
This is incredible; I didn't even know such a build existed. I can get an get an edge in battle with this useful piece of information
Glad it was helpful, Thanks dear @Sam.Clements
Mind blown! Never in my wildest imagination I would have thought this was possible to do it on Excel.
Excel never fails to amaze me. In my last organization, they were literally running batch jobs in excel.
ua-cam.com/video/mJfg-XJ7hK4/v-deo.html
Excel formulas language is Turing complete. You can have there anything a computer can do
let me say this clearly. the entire world financial markets rely on, depend on, and exist solely on MS excel. if they sent out a "nuke" command code via an update the worldwide economy would crash and we would have instant wars.
True, I was mind blown when I first discovered what can be done with PowerPoint, seeing the same being the case for Excel is just, wow. As a student, I guess it's time to learn some Excel.
Honestly, it's the OTHER LEVEL, your videos gave me a huge inspiration enhancing my creativity level personally, before watching your tutorials I thought I am good enough in excel! but after your videos, I realized there are much more you can do by connecting things together, It's not only the rigid knowledge of the app that takes you to the next level. It depends on how you can utilize it. Thanks for the priceless effort you made through all your videos whoever is behind this channel.
Wow, Thank You much appreciate mohammed....May you please contact us if you dont mind dear
@@OtherLevels Sure, done. Sent an E-mail via your website.
Thanks!
Thank You Antonio for your Support ❤
@@OtherLevels where should I get the data that is in your Datasheet. Where can I download it ?
i think you should use background music
Где найти таких специалистов ?
Finally they are starting to catch up with Emacs.
Honestly.... jaw on the floor in awe of this masterpiece. I can't believe this was done in excel. I watched the entire tutorial and I'm still in shock. This is absolutely insane...
We appreciate that, Glad you liked it
So I'm pretty good at excel. I use it daily as my primary tool for work and I must say - I am beyond blown away by how beautiful and impressive this is. It has opened my mind to a whole 'other level! I can't believe it! It's just so stunning! Going to be taking inspiration from this moving forward and definitely showing this video to others since it's so insanely genius!
This is incredible; I didn't even know such a build existed. I can get an get an edge in battle with this useful piece of information
A Microsoft Edge!
This is art. One tip: How about creating a base design and then duplicating the worksheets? Saves time in formatting other worksheets alike and copy-pasting similar elements.
my thoughts exactly
DRY all the way!!
Hello sir , i am a beginner and I would request you to teach me how to use excel better
My friend, did you realized that this is a tutorial, or a DIY, or even, How to do... video? It's step by step how to create something from scratch.
This is absolutely awesome work, I would not have believed this was possible with Excel had I not seen it.
Glad you liked it, Excel can do more and more
@@OtherLevels Even Excel didn't know this could happen
as a data analyst with a touch of art. this is way beyond presenting a data.
At this point I'm convinced you can program a game in excel
lol we're thinking about this ,thanks rei
@@OtherLevels if you ever make this happen then I'm freaking convinced you can use Word as photoshop
@@OtherLevels wouldn't that be just crazy and so unique! You pull that off and if I were you then I would build a whole community around that and sell your excel-based games as NFTs! Imagine that!
Hahahahahahahahahahahahahaha
This is crazy sarcasm
Making Photoshop out of word
Hahahahahahahahahahahahahahahahahahahahahahahahaha
@@rinnepy depends what you’re trying to use photoshop to do but since all images pasted within office programs are in layers you’d be surprised and how much you could do. Just would take a lot more time since it isn’t tailored for the use case.
Being someone who likes to create original digital art within programs like photoshop though, there would be a lot lost due to not having the brush engine.
Super Wonderful ^.^ Amazing Work!
it's an Honor to see you here One Skill,
Glad you like it! Thank you bro, appreciate it.
OMG 😍 We are here with TWO Kings, One for the Powerpoint and One for the Excel ❤
Really, i can't live without your both channels 🤩❤️
OoooHooooOOO All the MASTERS are here 😍❤️😍❤️😍
I Believe if @Other Levels and @One Skill PowerPoint work together, they can create an incredible system using PPT and Excel, Please think about it...for humanity
You'd never guess it is done in Excel. Outstanding work!
Thank you very much, excel can do more
waste of time. quicker done in pwr bi...
@@magnetoza It depends on different situations and circumstances. In finance, Excel is everywhere and known to pretty much everyone having to deal with numbers, for example. Even outside of finance, your dashboard may need to be given to senior management and other people not having the know how to use something more complicated. They may just want to browse the data and see quickly what things look like during the day. There is no need to give something more complicated to this user group.
A more viable competitor may well be to use a backend service to calculate and then feed the data to some webpages, but then you have to deal with the infrastructure to hold the components as well as to support everything later. For a small business, it is less likely to do this.
One of the best learning videos I have ever watched on UA-cam.
Thank you very much, We appreciate that dear Nitesh
I appreciate how the creators essentially took web design and applied those concepts to Excel. Very creative problem solving, excellent work.
This looks so amazing i'm commenting on it before i've watched it. You know this is the video everyone needs. You've come a long way, and i hope success sees you soon if not already.
Thanks Alex, Really Appreciate your support...Enjoy bro
Yes Alex, this is truly "Other Levels" 😁🙌🏾🔥🔥🔥
i8ii
I've never designed any Excel Dashboard but this is highly impressive. I'm glad it came in my recommended
Thank you very much, It's for our pleasure
I cannot believe this, this is art !!!
Thank you very much Corel
this absolutely was not what I was looking for but this is INSANE! This is ANOTHER level of excel. I did not know this was possible wtf ? Amazing!
I literally got goosebumps just looking at the UI. This is no longer "other levels" this is TRANCENDENTAL!!!!!
p.s. subscribed
This is really other Excel level, you guys are the bests!
Wow, You are the best Gilson
This is awesome. 🤯 Just goes to show that there's a lot more to Excel. Thank you guys.
When I first saw the beginning of this video I was thinking you would start using clipart to make the sections of the dashboard but to see that you do it all from within excel and it's available tools is pretty amazing. I knew excel was capable for making dashboards but I never knew it allowed this much detail. I've been using data studio and sheets for quite a while now and I would love to have this much functionality in my dashboard workflow. It's making me think if only excel was as accessible as sheets/bq and data studio cost and shareability then I probably wouldn't hesitate to switch. Mircrosoft just adds such a huge pricetag to everything. Anyway excellent video
Just buy the student version of MS Office, it's about £50 a year, not exactly bank breaking for what you get.
Use mas tool. Thank me later
Thank you very much!
Thank you Harry for your support ❤️
Thank you! I would not have imagined this possible after so many years. Inspiration from an Excel video.
Glad it was helpful, thanks dear @dkirson609
Excel is the best creation of mankind. The entire financial world rests on it)
Indeed
00:36 Financial statistics system with multiple dashboards using Excel
02:49 Setting up the first dashboard and its elements.
10:51 Creating a scatter chart with multiple shapes and charts for the financial statistics dashboard.
14:24 Creating financial statistics dashboard elements in Excel
20:33 Creating and analyzing income sources dashboard
31:32 Use circular symbols and design a distinctive background for financial statistics dashboards system.
43:39 Creating financial statistics dashboards in Excel
51:01 Design a creative financial statistics dashboard system
Crafted by Merlin AI.
My mind couldn't comprehend that it's actually possible in excel. It is just so good. Magnificent
The content so good that i dont skip ads and use it as my breaktime to make a little support to this channel
We appreciate that, Glad you enjoy our content
i never ever thankful from youtube recommendation ever. i am glad youtube understand me
It is amazing! Do not ever stop creating/sharing these great works please! Btw when do we get the next part? 😊
Thank you very much’ tutorial 2 will be ready this week😍
@@OtherLevels thank you! Can't wait 😍
Wow, a jaw-dropping design
Glad you like it! Thanks Ahmed
The most beautiful and absolutely UNNESSCARY sheet I've ever seen. Truly a design masterpiece.
Wow..Thanks JiveCinema, Glad you like it
@@OtherLevels I was messing with you bro. Your work is amazing and I've been sharing it with fellow investors.
Your knowledge in excel management is too much. Respect
I knew excel was capable for making dashboards but I never knew it allowed this much detail. you are amazing thank u
I showed this to my excel and my excel uninstalled itself.
I’m just amazed with these videos. Didn’t know Excel had such capability! Great job! Thanks a lot for these videos!
It's not excel. It's the person. No wonder you are always discovering and not the innovator.
Thats quite amazing, I am used to making charts and visual aid fo projecks in Msexcel but the design was never on my strong side, I am sure to learn something very usefull from this tutorial.
it's our pleasure , Glad you like it
OMG this is beautiful. Overwhelming for some but it's technological art.
Thank you very much dear Northern
This is truly Other Level and beyond my comprehension. I gotta watch the video twice or thrice to get the hang of it !!
Thank you very much dear, we appreciate that
This is insane! 😲
Your dashboards have come quite far...bravo! 👏
Is this excel dashboard or NASA launch rocket control system 😅😅
What wonderful dashboard
I’m amazed by ur work ❤❤❤
Thank you very much dear Mohammed, Glad you liked it
First question of the Project Manager:
"Where is the Export to Excel button?"
This is definitely NEXT LEVEL,
you're on the NEXT-LEVEL
Thanks Richky, we appreciate that
Amazing...!!! Haven't thought we can create something like this in Excel. This is Masterpiece
Yes, definitely,Thanks dear @darshitgandhi1296
This is the most incredible dashboard I've ever seen! I have no words...
The AI and Crypto Deck creators are going to have a Blast using this in their next sales deck and concept notes.
This was an exceptional tutorial, Hope to see more themes of Styles to do in Excel, Maybe an Agency Model for Digital Marketing plan or Social Media content theme.
It's fun yeah but I don't understand why this is special. Why not directly using Affinity or Pixelmator?
This is super cool - great work.
My only critique of these types of dashboards, and I'm curious of your thoughts, is that if new data series are added (for example: a new method of Advertising, like say Magazine or instagram, etc) you need to manually go in and add that line item to the dashboard doughnut chart.
I love these creative dashboards. But it is these exact type of limitations for why I can't hand them off to my boss or some other user - because it constantly needs my manual updating.
Couldn't you design basically a Form to fill say on a spare spreadsheet tab so that other users could add that needed info tap like an "add to charts" button and then script that updating so that any user could do those edits :)?
@@Aetheric I know with tables you can auto update lists at any time. Simple pivot references would auto update. However the scripting of the additional series to the dashboard custom charts, that's a bit technical for me.
But that's what keeps you in a job.
I guess you can bring some VBA to keep the dashboards updateable for new added info at any time.
@@ghost_shadow VBA is good when users know how to enable macros...
So impressed!! I’ve never seen this level of genius in my whole life! Amazing!!
First time liking a video before watching, and First time Subscribing to Channeling without thinking
We need more UI or I should say more GUI like this . I saw years ago this interface for music were the songs were clusters of little stars and the albums were galaxies ...It was beautiful.
@Other Level's.... from 11:00 mins of the video I have been trying out where and how did you get the data for X and Y to prepare the scatter chart. Not sure if I missed out anything on the video but I surely cannot find it anywhere.
Me too 🥲
Same here!!!
I ve spent the whole night trying to figure that out as well.. I feel like giving up.. I am so stucked
did you find the x and y value how he created
Hey, did anyone ever figure this out or get a response from the creator?
Hey, has anyone figured this out now?
Really nice dashboard. However, I think it doesnt fulfill the main goal of a financial dashboard: to be easily readable, with all consistent information in one page. Here, we have some basic information, that not allow anyone to take any action or explanation (where come the variance, ...). Anyway, Good job for the design and thanks for the sharing. Really appreciate it.
I was going to say the same thing. I did this type of work and information overload defeats the purpose of a DASHBOARD.
Think of your cars dash board. If you had every metric possible on your cars dashboard it would take you forever to know if you're speeding or low on gas. A dash board should be simple in the data it provides as it should be the most critical pieces of data needed to make a decision. You should then build in sub sheets that allow you get additional detail for the metrics in question if needed,
This is cool looking, but it's too much data for practical use.
@@ikannunaplays I agree with you and with @Galiat. I've been watching some videos of Other Level's and, yes, they are all great, good-looking dashboards to please our views. However, the more sophisticated the videos have become, the more information is necessary to fill in the dashboards, and it's getting hard to see such a lot of information spread on every corner. It should be kind of simple and easier. And the time spent seems to have increased in order to make them - due to the amount of information displayed.
@@cassioalexan I second you both. It has to be simple, easily acessible and clear. After many years using third part solutions, developing my own app, I came back to a very simple spreadsheet, actually using google docs (because it gets the prices from the market) and I think that's the best for me. Also, the only colours I use is to point negative values (in red) and some big distortions (i. e. price lower than patrimonial value in x% ). Other than that, plain white.
for my business I made a semi CRM software, on which I used some pre made dashboards (css and javascript) it was fun for a while, but later I realized I only rely on more basic reports. some info come on it's dahsboard, but I have to check it on a basic report
For a boardroom presentation with high level numbers, this is perfect and I cannot ask for more. It looks great and I am sure it will impress a lot of em. As a management account and business analyst, I’ll stick with my messy pivot charts and tables to easily manoeuvre the ever changing number game within a business.
My mind is blown by this. This is amazing! Beautiful work!
We appreciate that Thanks dear Lyndsi
I write scripts for Excel and am pretty goods at using Excel but this is a whole new level of creativity. Good work.
Thank you very much, We appreciate that dear Luck
Wow. I am gonna learn this immediately lol. I don't understand the X Y values and how they are numbered for the circle locations. Could someone please explain?
Join our channel, and get answers to all your questions:
ua-cam.com/channels/uDF09RGFE3V3lY77Z_cA9g.htmljoin
did you end up finding the answer? I think they just placed them randomly
i have the same question i think they randomly put there to put the position of the circle
Hey, your work is just beyond amazing. I never knew that such an interactive and beautiful dashboard can be created in excel. Can you pls tell which excel version are you using ?
Today is my day 2 trying to complete this tutorial currently on 16:02 wish me luck
good luck bro🙏 you got this💪
Good luck Ahmed
Good luck!
Hope you succeed
From where you got the dataset
13:12 how to get those value by using vlookup ?
I'm feeling myself luckiest one on this planet after youtube recommend me this video. Now I don't know how it recommends me but I unconsciously clicked it and yeah it was my best decision ever. Now In Sha Allah it will progress my business by doing this art and yeah all of my employees would be rather astonished 😂😂
Thank you very much dear Ahmed we appreciate that
انا لا افهم في هذه البرامج و لكن هذه التصميم غاية في الروعة لكم كل الاحترام و التقدير علي عملكم الرائع هذه و الجهد المبذول .
Thanks dear @ex_cool3606
Hello, this presentation is beautiful. Attention however the link of your site in the description is not good. Good day to you
Amazing, I didn't even think you could do this with Excel...I haven't even seen anything like this being built on PowerPoint either.
It would be really great if you could provide the dataset so that we can follow along with the tutorial, I'm already itching to start learning myself!
Thank you very much, Excel can do more, To get dataset please visit our online store www.other-levels.com
When you want to convince the CEO that you are actually productive in the job while doing nothing really
This is next level sturvs. To think that everything was done in Microsoft Excel and without VBA is just mindblowing. Wow..wow...wow!
Dear thank you very much , we appreciate that, Glad you liked
This video changed my life.
Glad it was helpful for you dear @ChaojianZhang
This work is superb!
May I ask, what software you have used to create the dot and line to point the color hexcodes in 2:55 timeline?
yeah, we call it video editing software...prolly used adobe Premiere pro
anyone ok with 44:00 how do you change it to combo, while keeping it as a circle. when I change mine to combo it's not a donut anymore - it changes to a square
Same issue
@other's levels plz solve this
This looks stunning. I'm in a sales role and would love something like this to share quarterly sales results. Is there anyway to integrate with Salesforce?
I see the competitors in the Financial Modeling World Cup and the Excel World Championship using this. Ridiculously next level stuff
Uma obra de arte, sinceramente até me emocionei um pouco kk de tão bem feito e incrível, parabéns, te aconselho a estudar sobre como 'ranquear vídeos no UA-cam' te desejo tudo de bom e grandes conquistas, sucessos e abração =)
Muito obrigado
What in the f did I just watch?
Magic
you are watching solar system calculation. next maybe excel manage to calculate time paradox. haha excel are such bullshit😂
Yes
Great video. I started watching your videos last year as a beginner before giving stock market a trial. I was able to make $33,600 with a capital of $9,000 trading with an experience expert who guided me through out my trading.
how easy can it take to get her?
I want to wake up one morning and find out that my portfolio is $1,000,000. I know it’s possible
Seeing people making much money trading got me wondering what I’m doing wrongly.
Do you mind sharing some tips..
i i'm from garmany ,how can i reach her?
@Rose Reach her on T. E. L.
Mate, this is amasing and thank you so much for sharing. God bless you and give you everything you want.
My pleasure, glad you enjoyed our content, dear @ndelrio1
What a CREATIVITY!!! You can find Macro's, Visual Basic's and C#'s traces everywhere.. but where are they :)) just need to know a little PivotTable and some basic formulas, and of course, have like this ART of IMAGINATION.. congrats..
Thanks Yusuf, Excel have more ❤️
UA-cam has finally done something good. They recommended me this masterpiece.
Most welcome dear, Glad you enjoyed it
This is really on another level. I just subscribed.
Thanks dear glad you liked our content
HOLY MOLY !!! THIS IS ART !!!
Thanks dear Dhanar
I don't know why youtube recommended it. but i am thankful. this is great for work.
Mind blowing! Different level, seems this dashboard is coming from other universe .
Never seen such a skill and a gorgeous dashboard!!
Hi,
Tx! for publish this amazing video...
This is next level
Glad you liked it!
your video really represents your channel name. thank you, you gave me inspirations.
this is not a simple dashboards, this has become an art at this point
we appreciate that , Thanks dear Reisen
this is absolutely mind blowing! Great Job!
Thank you very much Kenner
And i feel like a pro, when i can add a checkbox into a cell :D
This is art!
Thanks dear
wow this thing is in another level !!
Kudos !
Thanks, We appreciate that dear Guille
This reminded me of the first time I watched a video of some guy drawing the Mona Lisa in the MS Paint with incredible detail. There will always be pro users who will just take things into the next level.
Thanks, we appreciate that dear @rmkkmrrmk
This is art. How immpresive this dashboard is. Great...thanks for sharing
We appreciate that, Most welcome dear Kartini
this guy can work for 1 day and enjoy for a whole week.
Super cool! Showing this to my coworkers!
our pleasure dear