Patrick, this is such an important video. WAAAAYYY too many analysts at my company use the "flat file" method. When I was a newbie, that's what I was taught, so I never questioned it, despite the process being slow and inefficient. I remember people using VLOOKUPS in excel, of all things, to mash together enormous tables and them load them up into Tableau (lol). The idea was literally "if Excel crashes, just try again". So much wasted time. So many fire drills when handling urgent requests. Then one day, a colleague of mine told me about power query and PBI, and it felt like my eyes were opened for the first time. This type of stuff may be second nature to a DBA, programmer, etc... but a lot of us in finance, accounting, sales ops, etc. don't have any experience with creating data models, writing DAX or SQL, etc. We end up taking the long, arduous path to get to our destination, because it's the only path we know. Little do we know that we have a freaking jetpack that we can use to get us there in no time at all. Great video.
Hi Pat, I have been following this technique in modeling my data for long, applying it to some of the most complex datasets, and it has never let me down in terms of analysis. It might sound basic, but it isn't. Once you master it, any analysis, no matter how intricate it is, becomes a piece of cake. Thanks for revisting it.
Dude, THANK YOU! This is one of the best tutorials for real world power BI usage. So many tutorials don't include these basic steps, or simply brush over them. You're kind, explain everything in detail, and best of all it friggin works like a charm. I can't thank you enough for relieving my frustrations. You're the best
Hi Patrick, Love this. I'm new to Power BI and one of the projects I'm going to be creating a report for only has flat data. So this is going to be a total life saver!! (You get two exclamation marks as one just doesn't do it) Maurice
Thank you for this and all of your insightful videos - I'm learning so much!!! One huge request I have is, can you add videos with qualitative social science survey examples? A big problem with learning PowerBi is 1. newbies don't know the PowerBi terminology to know what we need to learn, and 2. All of the examples across all the PowerBi samples I've seen tend to focus on product, sales, revenue, etc. types of data. It would be great to see a qualitative-focused social science survey with 50-100 questions, including lots of skip values and various section topics in the survey, with data showing the same survey's results for different language-speaking populations in one country, and then for different language-speaking populations in another country, and then show modeling builds and reports of that data by respondent profile (country, spoken language, sex, age), survey section, question groupings within or across sections, and skip logic. Please can you guys tackle this for us social scientists? THANK YOU!
Heck yes! 100% agree with this comment. This is part of why it seems so challenging to learn power bi because so many examples are related to sales, or data sets that have a ton of quantitative data to start. I am trying to pull in multiple data sets of survey Data from surveymonkey for example, have absolutely no idea how to merge the data together because it’s all unique fact tables. Sometimes it seems the only common denominator is date, otherwise how else can these datasets be combined Or tables liked by relationship? The surveys can all be from one overall program and it’s important to show them all to understand the big picture. Even in trying to merge all fact tables into one, the surveys and questions can all be very different. These are often random participants without any identifiers either. This is super hard. Very thankful for your videos, they do provide a lot of ideas and such. It’s still challenging going back and trying to apply these skills for the data evaluators or qualitative analysts.
CALENDARAUTO... why have you been hiding from me for 2 years? I think I often learn more from the lesser-focused topics than the main topics (sometimes). Thank you immensely!!!!!!!
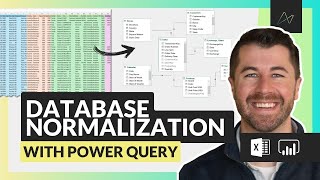
On a date with my flat file. Very useful and entertaining, thank you! So basically, the flat file was separated into one fact table and two (three) dimension tables with linkages.
Cool stuff! I used to deduplicate dimension tables in this way, by selecting all columns and then using remove duplicates. That has the risk that if the csv file is made up from different sources, the key might be duplicated with different definitions. My new approach is to sort the dimension table by modified date descending (if there is such a column) and then use remove duplicates only for the primary key column. If there are duplicate keys then this approach appears to retain the most recent definition due to the sort by date.
Hello, Thank you for a wonderful tutorial. I wanted to get more specific though in terms of what the benefits are of transforming a flat file into a star schema. Is it simply organizational in nature? Does it make the file size smaller? Do filters run more efficiently? What are the specific sort of benefits from transforming a flat file into a star schema? Thanks
Not sure if you have received the answer, but the whole process is called Normalization it helps your Data Model to be more efficient, save memory by removing redundant, and even great structure for your data!
I was wondering if I don't have the Productkey or Orderkey in the main datasheet. How we can make the relationship with the fact table after creating the different Product and Orders table.
I wish I knew this stuff well enough so I could be an honorary guy in a cube. However, with each video I am learning more and more and getting closer to this goal.
Patric! I did something similar recently but rather than duplicating the data set multiple times (which results in multiple queries, I did some basic cleanup and then created a bunch of reference queries for modeling. Is there a reason you duplicated rather than referenced ?
because power query is key sensitive I think you should add an upper or lower case for product names; in case you add new data ( preventing relationship)
Thanks for the explanation, few doubts I have 1. If the data doest have keys or codes how do you add. 2. If the file is dynamic how the above model works when there are new columns in next updated .csv file
Great video! Once I upload the model to PowerBI Services, where should I add new records to the data set at that point? Only on the cloud data set? Do I even need the local spreadsheet any more at that point? Not the one Power BI desktop, but the first local copy I started with. Any feedback is appreciated. Thanks
Hey Patrick !! BTW its nice VDO .. But if the flat file data is fully transactional where we store only keys for the respective dimensions then I don't think so we can create a model having Dimension tables (Key,Value pair) .. Any idea how to achieve this ? Thanks
@Patrick, how do you create a unique product key or territory key for a flat file that does not come with one and you need to make one to create lookup (dimension tables)?
So to link the pieces of data from one data table to the other, you just have to have at least one column in both with the same data to link the two together? I'm new to PowerBI and data table relationships :)
Hi Patrick, great tip! But I do it a little bit different ;) - Create a Sales_Raw query that is marked to not load - Reference the Sales_Raw for every other queries (ex: Product), remove the columns, remove duplicates Thanks
Hi im new to Power Bi and was wondering , if "i.T sent you an CSV file for month ending in March, and after you have created your data model, how do you update next months data? Do you just dump Aprils data to a main spreadsheet and Refresh data in power BI?
Hi sir. It's a great video! Just have a question that was asked to me. If you already have all the info that you need in the flat file, why do you have to split them up in different tables?
JC: You’re on the right track, and if PowerBI were programmed with true productivity in mind it would automatically do much of this for the user. It could have prompts asking us to name the tables, and a better way to view & decide which columns to keep. Also the whole date table creation is absurd and should be automatic. Knowledge workers intuitively understand that what counts is exploring the data in visualizations like tables, plots, and maps-not creating tables which imply relationships we already know are there! Tableau just added this same “relationships” feature and is making many people mad, who had to use contorted table & “level of detail” calculations to aggregate data correctly-which new users won’t have to learn! All these data apps fall short of humanity’s common sense. We need app developers to offer truly no-code tools.
Q: Thanks Patrick. Fab. If IT send you 10 sales excel for 10 departments, different format, how do you decide if we clean them up and combine into one table, or just keep them separated?
Quick question...with the duplication of the original query into 3, does that mean it reads that file in 3 times? If so, would using "with reference" get around this?
Great Video . Thanks. After you publish this on PowerBI.com how do you handle updates to the data? Also would this work well if the flag file is very large (many millions of rows). Thanks,
Patrick, great job! Awesome. What happens if I need to update the datas after aplying all these changes using the original file? Is it possible? Is it going to give a error message? Thank you. Is Power BI able to identify the changes?
Cool video, but why do you duplicate the queries? Why don't you just reference all of the transformation queries to the initial one? This way, your total loading time will be reduced, right? (This is maybe not an issue in your example but in real world)
Duplicate or reference? When you get a new file if you duplicate will it automatically update the 3 new tables in either option (example sales data in September then sales data in October)? Asking since you might have new products in October and new sales territories etc...Thanks! Videos are great!
Hey! Loved this video, do you have a data transformation video on excel speadsheets in a given scenario where a business might be still using excel as their database, you know, the common top 4 rows is a header, they use columns for Quarters and use aa single column as a category for different targets and a single column for target value? Keen to know if you have video to manage transformation to designa report out of this manual data entered spreadsheet.
Q hey Patrick is there any way to update the dimension table if new data is updated in the original flat/excel file.For eg we have 10 products in the original file but now new 2 rows products are added in original file
Appreciate that Awesh! What I mean by that is to reduce data silos and don't make copies of the data set. So that would mean publish your dataset (one Power BI Desktop file), and then create the report in a second Power BI Desktop file using a Live connection to the dataset). You can then reuse the dataset with multiple reports - even across workspaces.
Very helpful… until about the 8 minute mark when you started writing codes. No we don’t all know what you’re talking about but if that isn’t mandatory I can use this. My company REFUSES to train us but switched everyone over to Power BI, so this is my independent training. Thank you 🙏🏽
Hi! I know this is an old video but I am wondering... Is it better now doing all the data transformation using Data Flow instead of doing on PBI Desktop?
Thank you Patrick, this is awesome! I've been trying this yesterday with a Flatfile of 160MB and a second one with 50MB. When i either "Duplicate" or "relate" the Queries to the flatfile and build my dimensions, it seems that for "refreshing" its taking a loooong time, as it loads every flatfile as many times as i have created duplicates to build a dimension. Is there anything i can do about this? Am I going wrong at some place or is this normal behavior? Thank you :)
Love the video !! What happens though if IT doesn't expose the keys but only the corresponding text field ? Is there a way to build your own indexes for speed purposes ? Other than that. You are joining your data model on text fields which is not a good idea. Subscribed to you channel ;)
No problem! I will continue to like your videos and comment on things ! I love it! yes I know but will that ID stay in sync if you make a copy of the table and create do the same process say if you say only keep this column then create the Ids. I guess a good example of normalizing data would be a good video. Titled 'Generating your own keys when you have lots of text fields you need to slice on'
I Have a Table that has data with team scores/games Home and away scores. To be short - I need to Split the games into home and away to get goal difference etc. I have two ways: 1. Create a new table referencing the original file (group by home) & then Merge into this file the original file (this time aggregating what i require from the away records grouped - or expand and group again) 2. split the original file into 2 - home and away 2 reference files - grouped separately . Now eventually for calculations I will need to merge these two files again anyway. Which method would you recommend? since i cannot gather stats etc on powerbi how to know which method is more efficient? 1 + 1ref merge = 2 tables ( but with merge and 2 groupings VS 1 file split into two and then merge into 1. ( 4 tables) I think 1 is more efficient but 2 is more easy to manage and visualize? plus can get specific data pregrouped for reports? Any ideas/suggestions?
After building a Data Model from this flat file,What if on any other day v have data with same column name but different data...do v need to build Data Model again from Scratch or Power Bi fetch it...Pl Clarify me on it
Patrick, looking for help. I need to add a new column and data in my data set in excel, that will be uploaded into an existing PBI model. What would be the best way to accomplish?
I haven't watched this particular video but I was looking to remove an excel source connection from the exisistng model, there wasn't any way to do that. Once you connect excel to a sql data model , there is no way out. You can remove it from the model per se , but the connection still exist which causes dataset refreshing issues in the server. I was connecting a report to this data source with sql and excel source in the server. the refresh failed , so I thought I will remove this connection but it will not let me. If you find a solution for that please let me know.
Hi Patrick Does this methodology apply on Direct Query table instead of just flat CSVs? Working on an extremely complicated report, I've prepared a data table (flatten out/deformalized) in SQL Server by getting all the required columns for the report from different sources. I've ended up with some 180 columns and around 20 million rows. The PBI report will eventually be published to the Service (premium). What do you reckon, applying the cleanup method using different queries (as in this video), will help? Any insight is appreciated.
I was doing this until, i wanted to create a time series data model with ability to filter data by date, week, hour. if we do this approach we can definitely do that however when you want to create hierarchy for for date till hour level it gets tricky
I use filters in excel and can't import that filtered data into power bi... or haven't figured it out. so for now I'm stuck using excel and pivot tables. i'd love to use power bi to create daily reports and a work queue to share with my team.
I want to create dimension and fact table to have star model. . I have 2files. Both files have some common columns and similar data structure . Hence I am using Full Outer join , File one - 2085 recrods , file 2- 4981 records. What is the best join option i should be using ? Both files have some similar records. IS there a video/link which tells how to create dimension using merge? any help wll be highly appreciated
Hey Patrick Great videos! Question on "Best Practice" please.... If we're working with a nice clean data set, say a task tracker list in SPO, is it necessary to create a multiple table model? In my case i have a small list with maybe 50 entries (could be several hundred soon) so all my data is in one place. User name | Task | Start Date | Due Date | Task Status | % Complete | etc..... I'll need to create some additional calculations/ columns in the PBi table but don't feel that i need to create any more tables. Or should I?
It depends (with all things). I would still maybe look for areas to split dimensions from fact data. It could make calculations and visual creation easier to understand. With small data though, it may not be that big of thing. Some of this will come down to a business decision as well. With larger datasets, it becomes more critical, especially from a performance perspective.
If you duplicate the querys to build the dimensions, you read the source file serveral times. Could that be a performance issue with large files? Can it be an alternative to load all the file once and generate the dimensions as DAX tables? Bad for the memory usage, but better for load time?
After creating a date table, did you really need to manually set up a relationship between it and the other tables? I thought that's what "mark as date table" did automatically.
தகவல் தொழில்நுட்பம்: One should understand the history of data modelling, in fact its a fancy now, because the nucleus is nothing but System Analysis and Design before the Cott Rules which suggested based on Normalization [1NF, 2NF, & 3 NF], and before it an initial case work called algorithm will be decide on the structure, entities & attributes based on the business model, this is what we do in those days, but now jargon takes the same like algorithm as cubes, normalization techniques as dimensions and facts as entities and attributes and keys and measures for facts ; besides in Tamil Language "தகவல் தொழில்நுட்பம் " meaning 'Data and its Science' is what is now called in english as "Information Technology", in reality its already identified, now its rediscovered in different articulation with medium as english
Where you have l lot more influence on Power BI than I do, it would be greatly appreciated if you could please pass along a feature request. In Transform Data, Home, Manage Columns, Choose Columns, it would be a great help if the column name would show if the column is being used in the data model. That way the reports do not crash out when refreshed when a column is unselected that is being used in the data model. This would greatly simplify eliminating unnecessary columns and would also help reduce the size of the data being loaded.


Patrick, this is such an important video. WAAAAYYY too many analysts at my company use the "flat file" method. When I was a newbie, that's what I was taught, so I never questioned it, despite the process being slow and inefficient. I remember people using VLOOKUPS in excel, of all things, to mash together enormous tables and them load them up into Tableau (lol). The idea was literally "if Excel crashes, just try again". So much wasted time. So many fire drills when handling urgent requests. Then one day, a colleague of mine told me about power query and PBI, and it felt like my eyes were opened for the first time.
This type of stuff may be second nature to a DBA, programmer, etc... but a lot of us in finance, accounting, sales ops, etc. don't have any experience with creating data models, writing DAX or SQL, etc. We end up taking the long, arduous path to get to our destination, because it's the only path we know. Little do we know that we have a freaking jetpack that we can use to get us there in no time at all. Great video.
This is absolutely true - giving people no/low code tools doesn't make them programmers.
Hi Pat, I have been following this technique in modeling my data for long, applying it to some of the most complex datasets, and it has never let me down in terms of analysis. It might sound basic, but it isn't. Once you master it, any analysis, no matter how intricate it is, becomes a piece of cake. Thanks for revisting it.
Dude, THANK YOU!
This is one of the best tutorials for real world power BI usage. So many tutorials don't include these basic steps, or simply brush over them.
You're kind, explain everything in detail, and best of all it friggin works like a charm.
I can't thank you enough for relieving my frustrations. You're the best
Patrick, sometimes going back to basics is just great. Thanks for putting this together!
I agree. We are doing to be doing more videos like this.
Thanks Patrick, your relaxed humor sets you apart from others and makes it easy to watch you videos.
Much appreciated Jonathan! Thanks for watching 👊
Hi Patrick, Love this. I'm new to Power BI and one of the projects I'm going to be creating a report for only has flat data. So this is going to be a total life saver!! (You get two exclamation marks as one just doesn't do it) Maurice
Thank you for this and all of your insightful videos - I'm learning so much!!! One huge request I have is, can you add videos with qualitative social science survey examples? A big problem with learning PowerBi is 1. newbies don't know the PowerBi terminology to know what we need to learn, and 2. All of the examples across all the PowerBi samples I've seen tend to focus on product, sales, revenue, etc. types of data. It would be great to see a qualitative-focused social science survey with 50-100 questions, including lots of skip values and various section topics in the survey, with data showing the same survey's results for different language-speaking populations in one country, and then for different language-speaking populations in another country, and then show modeling builds and reports of that data by respondent profile (country, spoken language, sex, age), survey section, question groupings within or across sections, and skip logic. Please can you guys tackle this for us social scientists? THANK YOU!
Heck yes! 100% agree with this comment. This is part of why it seems so challenging to learn power bi because so many examples are related to sales, or data sets that have a ton of quantitative data to start. I am trying to pull in multiple data sets of survey Data from surveymonkey for example, have absolutely no idea how to merge the data together because it’s all unique fact tables. Sometimes it seems the only common denominator is date, otherwise how else can these datasets be combined Or tables liked by relationship? The surveys can all be from one overall program and it’s important to show them all to understand the big picture. Even in trying to merge all fact tables into one, the surveys and questions can all be very different. These are often random participants without any identifiers either. This is super hard. Very thankful for your videos, they do provide a lot of ideas and such. It’s still challenging going back and trying to apply these skills for the data evaluators or qualitative analysts.
CALENDARAUTO... why have you been hiding from me for 2 years? I think I often learn more from the lesser-focused topics than the main topics (sometimes). Thank you immensely!!!!!!!
So much easier to learn and follow - your teachings skills are brilliant - fell asleep on so many other videos
this is so much better than the rest of power bi tutorials, great job!
On a date with my flat file. Very useful and entertaining, thank you! So basically, the flat file was separated into one fact table and two (three) dimension tables with linkages.
Patrick, you are always make me smile. Thanks!
Woot! Mission accomplished! Thanks for watching Jack! 👊
Get intimate with it Pat! 😂 man you’re great.
You can also remove duplicates by clicking on the option in top left corner icon of the table in query editor. Saves time ;)
Yup! So many different ways to do stuff. Thanks for calling that out!
This just popped up in my feed two years later, but still a great tip for getting started in modeling.
haha love it! 👊
Beautifully explained. Love the content!
Bro you are out of this world good.
Literally my whole team is watching your videos now
Cheers from BR
Cool stuff! I used to deduplicate dimension tables in this way, by selecting all columns and then using remove duplicates. That has the risk that if the csv file is made up from different sources, the key might be duplicated with different definitions. My new approach is to sort the dimension table by modified date descending (if there is such a column) and then use remove duplicates only for the primary key column. If there are duplicate keys then this approach appears to retain the most recent definition due to the sort by date.
Great video. Although I'm a bit stumbled on what to do if I don't have keys in the original file. Is there a way to add them?
I need the basics - I'm just starting out - Thanks for going back to the basics
Hello,
Thank you for a wonderful tutorial. I wanted to get more specific though in terms of what the benefits are of transforming a flat file into a star schema.
Is it simply organizational in nature? Does it make the file size smaller? Do filters run more efficiently? What are the specific sort of benefits from transforming a flat file into a star schema? Thanks
Not sure if you have received the answer, but the whole process is called Normalization it helps your Data Model to be more efficient, save memory by removing redundant, and even great structure for your data!
I was wondering if I don't have the Productkey or Orderkey in the main datasheet. How we can make the relationship with the fact table after creating the different Product and Orders table.
Great video as always Patrick, good run through on the basics of creating a data model from scratch
Perfect 👌
It's always important to go back to basics 👏
agreed! 👊
This is the gold nugget. GOLD!!!!!
I wish I knew this stuff well enough so I could be an honorary guy in a cube. However, with each video I am learning more and more and getting closer to this goal.
Loved your explanation ! easy to grasp and right to the point!!
Patric! I did something similar recently but rather than duplicating the data set multiple times (which results in multiple queries, I did some basic cleanup and then created a bunch of reference queries for modeling. Is there a reason you duplicated rather than referenced ?
because power query is key sensitive I think you should add an upper or lower case for product names; in case you add new data ( preventing relationship)
Great call out! Thanks for mentioning that!
These videos never miss!
“Out in the wild” 😂😂😂
I love it!
Patrick's a wild man!
Thanks for the explanation, few doubts I have
1. If the data doest have keys or codes how do you add.
2. If the file is dynamic how the above model works when there are new columns in next updated .csv file
Great tutorial - it's really helped me out. Also Texas represent!
Interesting, Thank you for sharing Patrick
Most welcome. Thanks for watching Mehdi!
Great set of videos Patrick!
Great video! Once I upload the model to PowerBI Services, where should I add new records to the data set at that point? Only on the cloud data set? Do I even need the local spreadsheet any more at that point? Not the one Power BI desktop, but the first local copy I started with. Any feedback is appreciated. Thanks
Good question would Microsoft forms work as a way to input data?
Hey Patrick !! BTW its nice VDO .. But if the flat file data is fully transactional where we store only keys for the respective dimensions then I don't think so we can create a model having Dimension tables (Key,Value pair) .. Any idea how to achieve this ? Thanks
Back to basics is always good.
@Patrick, how do you create a unique product key or territory key for a flat file that does not come with one and you need to make one to create lookup (dimension tables)?
@Patrick, I'm wondering the same thing
Patrick Great Post so clean the file and creation the table that will be used. Just have issue trying to set them up
So to link the pieces of data from one data table to the other, you just have to have at least one column in both with the same data to link the two together?
I'm new to PowerBI and data table relationships :)
Hi Patrick, great tip! But I do it a little bit different ;)
- Create a Sales_Raw query that is marked to not load
- Reference the Sales_Raw for every other queries (ex: Product), remove the columns, remove duplicates
Thanks
Video with this approach coming soon! Thanks
@@GuyInACube Where is this video?
i love your tutorials man. you are amazing.. respect
First Time and I am loving it!!! Thanks!
Thankyou for making it look so simple
Hi im new to Power Bi and was wondering , if "i.T sent you an CSV file for month ending in March, and after you have created your data model, how do you update next months data? Do you just dump Aprils data to a main spreadsheet and Refresh data in power BI?
use request from folder in pq
Hi sir. It's a great video! Just have a question that was asked to me. If you already have all the info that you need in the flat file, why do you have to split them up in different tables?
JC: You’re on the right track, and if PowerBI were programmed with true productivity in mind it would automatically do much of this for the user. It could have prompts asking us to name the tables, and a better way to view & decide which columns to keep. Also the whole date table creation is absurd and should be automatic.
Knowledge workers intuitively understand that what counts is exploring the data in visualizations like tables, plots, and maps-not creating tables which imply relationships we already know are there! Tableau just added this same “relationships” feature and is making many people mad, who had to use contorted table & “level of detail” calculations to aggregate data correctly-which new users won’t have to learn!
All these data apps fall short of humanity’s common sense. We need app developers to offer truly no-code tools.
Exactly what I needed, thank you.
Q: Thanks Patrick. Fab. If IT send you 10 sales excel for 10 departments, different format, how do you decide if we clean them up and combine into one table, or just keep them separated?
thanks Patrick- another great video :)
Thanks! 👊
Thank you Patrick.
I am Power bi newbie and wondering if you have videos on org change impacts reporting in PowerBi?
7:53- shift+enter to start a new line in the formula bar.
Great work Patrick
Appreciate that! Thanks for watching! 👊
great example. could you also provide the data you are working with?
Dude you're brilliant
Quick question...with the duplication of the original query into 3, does that mean it reads that file in 3 times? If so, would using "with reference" get around this?
ua-cam.com/video/i_JHm-b3Jes/v-deo.html
Great Video . Thanks.
After you publish this on PowerBI.com how do you handle updates to the data?
Also would this work well if the flag file is very large (many millions of rows).
Thanks,
Patrick, great job! Awesome. What happens if I need to update the datas after aplying all these changes using the original file? Is it possible? Is it going to give a error message? Thank you. Is Power BI able to identify the changes?
Cool video, but why do you duplicate the queries? Why don't you just reference all of the transformation queries to the initial one? This way, your total loading time will be reduced, right? (This is maybe not an issue in your example but in real world)
Thanks Lars. Video discussing this coming soon.
@@GuyInACube Was the video released? I cant find it in the channel! :(
Great video! So, which table would you use for calculations and create new columns? I mean, the fact table? Do you even need it?
Thx for your input!
It depends on the calculation and the referenced columns.
Duplicate or reference? When you get a new file if you duplicate will it automatically update the 3 new tables in either option (example sales data in September then sales data in October)? Asking since you might have new products in October and new sales territories etc...Thanks! Videos are great!
Hey! Loved this video, do you have a data transformation video on excel speadsheets in a given scenario where a business might be still using excel as their database, you know, the common top 4 rows is a header, they use columns for Quarters and use aa single column as a category for different targets and a single column for target value? Keen to know if you have video to manage transformation to designa report out of this manual data entered spreadsheet.
Love it and great explanation 😍
Q hey Patrick is there any way to update the dimension table if new data is updated in the original flat/excel file.For eg we have 10 products in the original file but now new 2 rows products are added in original file
Nice video, This is BI = Basic Intelligence for anyone.
haha nice. There are folks just starting though and aren't aware of this.
Awesome tip to duplicate to create other supporting tables...easier to get to STAR model!
Hey Patrick its a great video. I didn't get the last part where you said separate the Data Model and Data Viz.
Appreciate that Awesh! What I mean by that is to reduce data silos and don't make copies of the data set. So that would mean publish your dataset (one Power BI Desktop file), and then create the report in a second Power BI Desktop file using a Live connection to the dataset). You can then reuse the dataset with multiple reports - even across workspaces.
Thanks Patrick got that
Very helpful… until about the 8 minute mark when you started writing codes. No we don’t all know what you’re talking about but if that isn’t mandatory I can use this. My company REFUSES to train us but switched everyone over to Power BI, so this is my independent training. Thank you 🙏🏽
So excited about bi
Another good video, thanks Patrick
Hi! I know this is an old video but I am wondering... Is it better now doing all the data transformation using Data Flow instead of doing on PBI Desktop?
Thank you Patrick, this is awesome!
I've been trying this yesterday with a Flatfile of 160MB and a second one with 50MB.
When i either "Duplicate" or "relate" the Queries to the flatfile and build my dimensions, it seems that for "refreshing" its taking a loooong time, as it loads every flatfile as many times as i have created duplicates to build a dimension.
Is there anything i can do about this? Am I going wrong at some place or is this normal behavior?
Thank you :)
Hey i really liked your videos wonder if you can create a video on azure cost management usage details.
Thanks. This helps a lot 👍🏼
Thanks Pat. I just subscribed today.
thank you for wonderful video
Most welcome! Thanks for watching. 👊
Love the video !! What happens though if IT doesn't expose the keys but only the corresponding text field ? Is there a way to build your own indexes for speed purposes ? Other than that. You are joining your data model on text fields which is not a good idea. Subscribed to you channel ;)
Thanks Mike! You could end up generating an ID field from the Power Query side. You can generate columns within Power Query.
No problem! I will continue to like your videos and comment on things ! I love it! yes I know but will that ID stay in sync if you make a copy of the table and create do the same process say if you say only keep this column then create the Ids. I guess a good example of normalizing data would be a good video. Titled 'Generating your own keys when you have lots of text fields you need to slice on'
So useful. Thanks 🙌
Thanks for sharing.
Thanks for watching!
I Have a Table that has data with team scores/games Home and away scores. To be short - I need to Split the games into home and away to get goal difference etc. I have two ways: 1. Create a new table referencing the original file (group by home) & then Merge into this file the original file (this time aggregating what i require from the away records grouped - or expand and group again)
2. split the original file into 2 - home and away 2 reference files - grouped separately . Now eventually for calculations I will need to merge these two files again anyway. Which method would you recommend? since i cannot gather stats etc on powerbi how to know which method is more efficient? 1 + 1ref merge = 2 tables ( but with merge and 2 groupings VS 1 file split into two and then merge into 1. ( 4 tables)
I think 1 is more efficient but 2 is more easy to manage and visualize? plus can get specific data pregrouped for reports? Any ideas/suggestions?
After building a Data Model from this flat file,What if on any other day v have data with same column name but different data...do v need to build Data Model again from Scratch or Power Bi fetch it...Pl Clarify me on it
Patrick, looking for help. I need to add a new column and data in my data set in excel, that will be uploaded into an existing PBI model. What would be the best way to accomplish?
I haven't watched this particular video but I was looking to remove an excel source connection from the exisistng model, there wasn't any way to do that. Once you connect excel to a sql data model , there is no way out. You can remove it from the model per se , but the connection still exist which causes dataset refreshing issues in the server. I was connecting a report to this data source with sql and excel source in the server. the refresh failed , so I thought I will remove this connection but it will not let me. If you find a solution for that please let me know.
O boy you nailed it.
Good job.
May I know the name of Microphone you are using to record?
Hi Patrick
Does this methodology apply on Direct Query table instead of just flat CSVs?
Working on an extremely complicated report, I've prepared a data table (flatten out/deformalized) in SQL Server by getting all the required columns for the report from different sources. I've ended up with some 180 columns and around 20 million rows.
The PBI report will eventually be published to the Service (premium).
What do you reckon, applying the cleanup method using different queries (as in this video), will help?
Any insight is appreciated.
I was doing this until, i wanted to create a time series data model with ability to filter data by date, week, hour. if we do this approach we can definitely do that however when you want to create hierarchy for for date till hour level it gets tricky
Do you keep keys as whole numbers or you change the data type to text?
Please provide a link to the csv file so we can follow your steps. Cheers!
I use filters in excel and can't import that filtered data into power bi... or haven't figured it out. so for now I'm stuck using excel and pivot tables. i'd love to use power bi to create daily reports and a work queue to share with my team.
You would only need to bring over the flat table only
I want to create dimension and fact table to have star model. . I have 2files. Both files have some common columns and similar data structure . Hence I am using Full Outer join , File one - 2085 recrods , file 2- 4981 records. What is the best join option i should be using ? Both files have some similar records. IS there a video/link which tells how to create dimension using merge? any help wll be highly appreciated
Hey Patrick
Great videos!
Question on "Best Practice" please....
If we're working with a nice clean data set, say a task tracker list in SPO, is it necessary to create a multiple table model?
In my case i have a small list with maybe 50 entries (could be several hundred soon) so all my data is in one place.
User name | Task | Start Date | Due Date | Task Status | % Complete | etc.....
I'll need to create some additional calculations/ columns in the PBi table but don't feel that i need to create any more tables.
Or should I?
It depends (with all things). I would still maybe look for areas to split dimensions from fact data. It could make calculations and visual creation easier to understand. With small data though, it may not be that big of thing. Some of this will come down to a business decision as well. With larger datasets, it becomes more critical, especially from a performance perspective.
Thank you
I deal with flat file clients all the time! Love model views way better! SSIS into database schema no longer needed!?
Ditch SSIS for smalls or prototypes. But SSIS still has its firm place in automated enterprise-grade ETL and data integration pipelines.
Nice video, good example tells how to create your own data model step by step
Thanks for watching Xiaomo!
If you duplicate the querys to build the dimensions, you read the source file serveral times.
Could that be a performance issue with large files? Can it be an alternative to load all the file once and generate the dimensions as DAX tables?
Bad for the memory usage, but better for load time?
Same questions here
Excellent!
After creating a date table, did you really need to manually set up a relationship between it and the other tables? I thought that's what "mark as date table" did automatically.
Great stuff!
Great video thanks for doing this
தகவல் தொழில்நுட்பம்: One should understand the history of data modelling, in fact its a fancy now, because the nucleus is nothing but System Analysis and Design before the Cott Rules which suggested based on Normalization [1NF, 2NF, & 3 NF], and before it an initial case work called algorithm will be decide on the structure, entities & attributes based on the business model, this is what we do in those days, but now jargon takes the same like algorithm as cubes, normalization techniques as dimensions and facts as entities and attributes and keys and measures for facts ; besides in Tamil Language "தகவல் தொழில்நுட்பம்
" meaning 'Data and its Science' is what is now called in english as "Information Technology", in reality its already identified, now its rediscovered in different articulation with medium as english
Where you have l lot more influence on Power BI than I do, it would be greatly appreciated if you could please pass along a feature request. In Transform Data, Home, Manage Columns, Choose Columns, it would be a great help if the column name would show if the column is being used in the data model. That way the reports do not crash out when refreshed when a column is unselected that is being used in the data model. This would greatly simplify eliminating unnecessary columns and would also help reduce the size of the data being loaded.