(EViews10): ARIMA Models (Identification)

Вставка
- Опубліковано 12 вер 2024
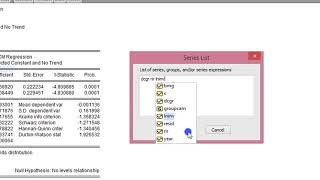
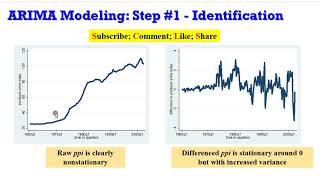
- How can the appropriate model be identified? Since, ARMA/ARIMA is a method among several used in forecasting variables, the tools required for identification are: correlogram, autocorrelation function and partial autocorrelation function. The partial autocorrelation (PAC) measures correlation between (time series) observations that are k time periods apart after controlling for correlations at intermediate lags (i.e., lags less than k). In other words, partial autocorrelation is the correlation between Yt and Yt−k after removing the effect of the intermediate Y’s (measures the marginal impact). To identify the appropriate ARMA/ARIMA model, I have outlines 5 procedures: (1) plot the series to visualise if stationary or not; (2) from the correlogram, calculate the ACF and PACF of the raw data. Check whether the series is stationary or not. If the series is stationary go to step 4, if not go to step 3; (3) take the first differences of the raw data and calculate the ACF and PACF from the correlogram; (4) visualise the graphs of the ACF and PACF and determine which models would be good starting points; and (5) estimate those models. Using EViews10, this video shows you how to identify an ARMA/ARIMA model. Here is the link to the Gujarati and Porter Ex21-1.wf1 dataset (EViews file) used for this tutorial cruncheconometr... datasets-2/. Endeavour to have a Google account for easy accessibility.
Follow up with soft-notes and updates from CrunchEconometrix:
Website: cruncheconometr...
Blog: cruncheconomet...
Forum: cruncheconometr...
Facebook: / cruncheconometrix
UA-cam Custom URL: / cruncheconometrix
Stata Videos Playlist: • (Stata13):Estimate and...
EViews Videos Playlist: • (EViews10):Interpret V...