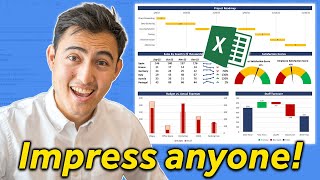
Interactive & Dynamic Dashboard using Pivot Table, Slicer, Doughnut Chart, Line Chart and Bar Chart

Вставка
- Опубліковано 5 жов 2024
- "Unlock the Power of Data with an Interactive & Dynamic Dashboard in Excel! 📊💻 Dive into this step-by-step tutorial where we guide you through creating an impressive dashboard that brings your data to life. Learn how to visualize trends, analyze insights, and customize your dashboard for maximum impact. Whether you're a beginner or seasoned Excel user, this video will elevate your data presentation skills and make you a dashboard master!"
#excel
#exceltips
Data Set:
bit.ly/3xhwDTp