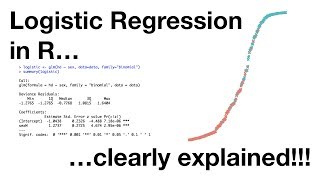
I downloaded the dataset from the link above and plotted chd ~ age but don't get anything like what is shown in the video. For starters the age range in the dataset is (39,59) while the video shows (20,70). Any ideas?
Hi Mike.. I am collecting real time data and I have many files. I want to merge all files of 8 months in a single file so I can see continuous variation in my data and then i want to have Summary of each day separately. I also want to do some correction in my data by applying some formula in some particular rows/column. How can I do all this.. I hope you understand what I am trying to say. please reply soon.
Hi, is there something specific you are referring to? we have 50+ videos teaching the use of R, right from the very beginning. if you are talking specifically about logistic regression, you can fit a model using *model


So far the best explanation about Logistic regression on UA-cam. Thanks
Really enjoying this series, Mary. Looking forward to the next one.
Thanks for sharing!!! Your explanations are super clear and easy to understand.
Thanks for knowledge sharing..... !!! You make life beautiful.....!!! :)
thanks a lot Mary! very intuitive and clear explanation!
You are the saviour. Thanks a lot :)
you're welcome :)
Thanks from Turkey
nice video, i very appreciated
Is there a list of the variables in the WCG data set? Some of them are obvious, but some of the variable names are rather cryptic.
where can I find the R code referenced here...this is such an elegant video...thanks !
we don't have the R code separately for these. you'd have to take a look at what is contained in the videos only at this time...
I downloaded the dataset from the link above and plotted chd ~ age but don't get anything like what is shown in the video. For starters the age range in the dataset is (39,59) while the video shows (20,70). Any ideas?
hi can i calculate this without needing to use logestic regression apps? i have no background in statistics this just happen to be my report
Technically, you can calculate it by hand, but it is MUCH simpler to do it using software
Could you provide the R script?
What's about z value ?
Can anyone explain, please
Hi Mike.. I am collecting real time data and I have many files. I want to merge all files of 8 months in a single file so I can see continuous variation in my data and then i want to have Summary of each day separately. I also want to do some correction in my data by applying some formula in some particular rows/column. How can I do all this.. I hope you understand what I am trying to say. please reply soon.
Hi, I'm sorry, but I'm not really clear on exactly what it is you want to do
Okay.. how can I write codes in R? If you know coding, please provide some best example.
Hi, is there something specific you are referring to? we have 50+ videos teaching the use of R, right from the very beginning. if you are talking specifically about logistic regression, you can fit a model using *model
It would be great if you talk a little slower.