Bravo! Love the fact that you took the time to show what an outlier might look like so as to change ones interpretation: the visual adds SO much to the lesson.
Greetings and best wishes to my youtube teacher @Dataslice! caught you after a long time. Thank you for another great video. A request followed... please make a series of videos on Regression covering its types, usage according to situations.
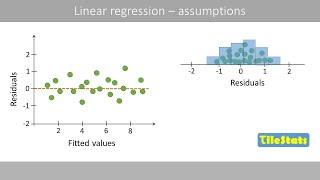
Hey, great video as always! Just a question: whats the benefit of looking at the graphs to check for homoscedasticity/normality rather than performing tests like Shapiro-Wilk or Breusch-Pagan? I'd also like to see a video about most common/useful linear transformations in the future (just a humble request). I always learn something from your videos, keep up the great work!
Great question! Using Shapiro-Wilk/Breusch-Pagan is a convenient way to quantify normality/homoscedasticity since they give you a p-value to interpret, but the graphs give you a more qualitative interpretation so you can understand normality/homoscedasticity in the context of your dataset. I agree that there may not be a huge added benefit of looking at the graphs, but in general, the combination of quantitative statistics + the qualitative interpretation of the plots can give a clearer understanding of the linear model. So tl;dr, I think it’s best to understand all the possible tools/tests/graphs available and use them as needed! Linear transformations would be a good topic to cover - I’ll add it to the backlog! :)


THIS IS WHAT I NEEDED MY ENTIRE UNDERGRADUATE COURSE
The return of the king!
When the world needed him most, he returned
Your channel is great!!! Why have you stopped posting? Your content was awesome!
Bravo! Love the fact that you took the time to show what an outlier might look like so as to change ones interpretation: the visual adds SO much to the lesson.
How are you so clear and concise? It buffles me. You really know your work but most importantly, You distil it very well. Thanks
Your video is the most helpful resource I found now! clear explanation and intuitive examples! Thank you and looking forward to more videos💯👍
These videos are fantastic - will you be making any more?
Dataslice! Where have you been? Would love to see you return to uploads. Your videos are fantastic!
Thanks, I appreciate the kind words! Life has been busy but I’d love to get back into it
You're back!
Very helpful. Thanks.
Another brilliant video 👍👍👍
thanks for addressing OLS assumptions :)
Thank you, this was extremely helpful
Greetings and best wishes to my youtube teacher @Dataslice! caught you after a long time. Thank you for another great video. A request followed... please make a series of videos on Regression covering its types, usage according to situations.
This one would be amazing.
Awesome! Thank you so much!
Part 1 (Regression *Summary* Explanation): ua-cam.com/video/7WPfuHLCn_k/v-deo.html
link to the dataset fish_df?
Hey, great video as always! Just a question:
whats the benefit of looking at the graphs to check for homoscedasticity/normality rather than performing tests like Shapiro-Wilk or Breusch-Pagan?
I'd also like to see a video about most common/useful linear transformations in the future (just a humble request). I always learn something from your videos, keep up the great work!
Great question! Using Shapiro-Wilk/Breusch-Pagan is a convenient way to quantify normality/homoscedasticity since they give you a p-value to interpret, but the graphs give you a more qualitative interpretation so you can understand normality/homoscedasticity in the context of your dataset. I agree that there may not be a huge added benefit of looking at the graphs, but in general, the combination of quantitative statistics + the qualitative interpretation of the plots can give a clearer understanding of the linear model. So tl;dr, I think it’s best to understand all the possible tools/tests/graphs available and use them as needed!
Linear transformations would be a good topic to cover - I’ll add it to the backlog! :)
@@dataslice Thanks for your answer. I'll be waiting for the linear transformations video, cheers!
How is able to print directly to the terminal?
This is great video but how can we plot it using caret models. I have tried the same plot function on caret lm model but it doesn't work. Thanks !!
Got it. For caret have to use model$finalModel
Where is the code to create these plots ?