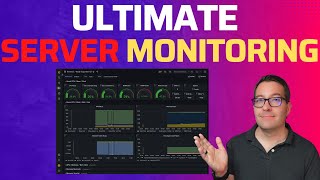
Installation of Grafana and AWS Metrics Dashboard Set-up
Вставка
- Опубліковано 6 жов 2024
- Here is the step-by-step guide to installing the Grafana on an EC2 Instance -
Step 1: Change to Root user: sudo su
Step 2: The installation is via yum repository. Create a grafana.repo under /etc/yum.repos.d/ vi grafana.repo
Step 3: Put below content in grafana.repo and save it.
[grafana]
name=grafana
baseurl=packages.grafa...
repo_gpgcheck=1
enabled=1
gpgcheck=1
gpgkey=packages.grafa...
sslverify=1
sslcacert=/etc/pki/tls/certs/ca-bundle.crt
Step 4: Once done with the above steps. It's time to install grafana now. sudo yum -y install grafana
Step 5: Start the server -
sudo systemctl start grafana-server
systemctl status grafana-server
That's it. Your installation is completed. Please access it using server-ip:3000


Thank you so much for making this video. Very insightful.
thanks for your feedback 🙂
I learnt a lot from this video, Thank you 😊
Thanks much for your feedback 🙂
Can i Monitor all the Ec2 instances running in that account with single configuration and i need metrics of EC2 like instance type, CPU Usage, Disk Usage and Memory Usage.
Yes, you can monitor all EC2 instances running in any AWS account with a single configuration in Grafana by leveraging AWS CloudWatch as your data source.
Excellent
Thanks for your feedback 😊
Can you please share the IAM custom policy.
{
"Version": "2012-10-17",
"Statement": [
{
"Sid": "VisualEditor0",
"Effect": "Allow",
"Action": [
"ec2:DescribeInstances",
"cloudwatch:GetMetricData",
"ec2:DescribeTags",
"ec2:DescribeRegions",
"cloudwatch:GetMetricStatistics",
"cloudwatch:ListMetrics"
],
"Resource": "*"
},
{
"Sid": "AllowReadingTagsInstancesRegionsFromEC2",
"Effect":"Allow",
"Action": ["ec2:DescribeTags","ec2:DescribeInstance","ec2:DescribeRegions"],
"Resource":"*"
},
{
"Sid": "AllowReadingResoucesForTags",
"Effect":"Allow",
"Action":"tag:GetResources",
"Resource":"*"
}
]
}
thanks
thank you :-)
Suprb
Thank you for your feedback 😊
Hi
I need your help i have some confusion
yes, kindly do let me know
what about memory metrics?
You may go through official docs to bring up different kinds of logs & metrics data to Grafana.
Can you please share IAM policy
{
"Version": "2012-10-17",
"Statement": [
{
"Sid": "VisualEditor0",
"Effect": "Allow",
"Action": [
"ec2:DescribeInstances",
"cloudwatch:GetMetricData",
"ec2:DescribeTags",
"ec2:DescribeRegions",
"cloudwatch:GetMetricStatistics",
"cloudwatch:ListMetrics"
],
"Resource": "*"
},
{
"Sid": "AllowReadingTagsInstancesRegionsFromEC2",
"Effect":"Allow",
"Action": ["ec2:DescribeTags","ec2:DescribeInstance","ec2:DescribeRegions"],
"Resource":"*"
},
{
"Sid": "AllowReadingResoucesForTags",
"Effect":"Allow",
"Action":"tag:GetResources",
"Resource":"*"
}
]
}