Cluster Observations Analysis (PART-1): Detailed illustration with Practical Example in Minitab

Вставка
- Опубліковано 5 вер 2024
- Hello Friends,
In this video, we are going to learn the 6th tool of multivariate analysis in Minitab software, that is, Cluster Observations Analysis with the help of a practical example for easy understanding and better clarity.
The Cluster Observations Analysis is used to join observations that share common characteristics into groups. This analysis is appropriate when you do not have any initial information about how to form the groups.
This video consists of the following topics:
• What is Cluster Observations Analysis?
• Data Considerations (Requirements) for Cluster Observations Analysis
• Example of Cluster Observations Analysis
• Detailed procedure to conduct Cluster Observations Analysis in Minitab
• Selection of various options while conducting Cluster Observations Analysis
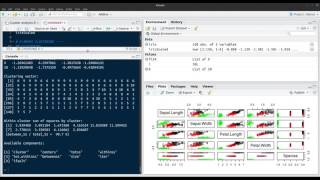
• Final Result of an Analysis in Session window and Dendrogram
We are committed to “Delight our customers beyond their satisfaction and change their lives in a positive way”.
As a part of it, we are providing the below services in Lean Six Sigma:
• Yellow Belt Online Training with Certification
• Green Belt Online Training with Certification
• Black Belt Online Training with Certification
• Detailed Minitab Training
• Mentoring and Coaching in Execution of Lean Six Sigma
You can access our website and can become part of this Practical Approach and the most Effective training by visiting the link-
www.learnandap...
And finally, thank you for watching…
#MultivariateAnalysis #ClusterObservationsAnalysis #MultivariateTools #MultivariateToolsInMinitab #MultivariateAnalysisMinitab #ClusterObservationsAnalysisMinitab #ClusterObservations #ClusterObservationsExample #ClusterObservationsProcedure #LeanSixSigma #SixSigma #SixSigmaTraining #SixSigmaCertification #SixSigmaOnline #Dendrogram #DendrogramClusteringExample


Thank you for the helpful video. May I know about the number of cluster, how do we determine the number of clusters that in the dialogue box
Thank you for your valuable comments and appreciation!🙏😊
It's a great question.
First, execute cluster analysis without specifying a number of clusters. Examine the similarity and distance levels in the Session window results and the dendrogram.
Based on the output, you will get clarity about clusters in data. Use the same number of clusters and rerun the analysis to see the cluster observation analysis clearly.
I hope this will help you.
Why are my genotypes having lowest yield are placed in cluster group having highest yield during cluster centroid analysis... please answer
Can you please elaborate your question?
For my analysis its coming error as all complete, included rows have the same value..... What to do for solving this problem?
The Cluster Analysis intends to group the data based on their similarities. If you have data with the same values, it won't segregate them into groups.
Can you please elaborate more on the problem you are facing?
Q, how we can determine the number of clusters from our raw data ?
Please look the number of groups generated based on similarities between data points.
Dear Speaker, pls is it possible to use this cluster analysis dendrogram to analyse semi- qualitative interview data (that do not have a relation like good, bad , not sure).
Yes, possible. Have you tried it?
Hi, I need to do meta analysis of cluster group s or dependent outcome. Do you have a video on that plz?
Yes, we can use the cluster observations analysis in this case.
If you can elaborate more on it, I will help you in the selection of the correct tools.
If you want to learn other multivariate tools as well, visit vijaysabale.co/multivariate