Isn't that obvious that most frequent (bars with highest frequency) defects must be treated first for maximum efficiency? I mean what value did Pareto chart add to this?
The curved line lets you know at a quick glance which bar has the most bang for buck, and the intersection with the 80% line tells you at what point you need to stop to be able to handle the first 80%. It’s confusing because of the double y-axis. But the graph at the end tells you that column A + column B add up to 80%.
I agree to a point. However, a pareto chart prevents jumping to the root cause of a problem and its a good visual to share with personnel to see how outages and their improvements help an organization.
I also had the same issue when I first saw this. First you need to know the rules of a Pareto Chart: Rule #1: The frequency bars (blue bars above) must have the highest values on the left and decrease accordingly as you move right. Rule #2: Your percentage line (red dotted line above) must increase to 100% as you continue right. So, in the graph above, there are two Y-axis. The first one (on the left) has the frequency (how many times a defect occurs) 1-10 occurrences. The other Y-axis (on the right) shows the relative frequency a.k.a. the percentage of occurrence, 1-100%. This percentage represents how much a single defect (a,b,c, or d) occurs compared to the total amount of defects. The blue bars are explained by the y-axis on the left and the line is explained by the y-axis on the right. For example: from above it looks like there are a total of 20 defects that have occurred. Of those 20 total defects, Defect A occurred 8 times (8/20) = 40%. As you continue right you accumulate (add) the occurrences in order to place your line in the correct location. Continuing....Defect B occurred 5 times out of the total 20 times so...(5/20)=25%. Once the line is at the B defect bar above, the line should be at 40%+25%=65%. You continue this with each bar until you reach 100%. If this unclear I understand. This should not make sense in a youtube comment section.
Thank you for the explaination! A question, why is the third axis needed if the y-axis has to be sorted from the highest frequency to the lowest? Isn't then obvious that the first columnt on the left is the column for the defect which we have to start resolving first to achieve the highest possible impact?
Honest question, and semantical I'm sure, but he said that a Pareto Chart has two Axes; and then said "it has a X-axis, a Y-axis, and another X-axis". Wouldn't that be three Axes? Or because there are two X-axis, those count for 1, & added to the Y-axis, together count as two overall?
I can deduce the equation for the line based on a brief view of the spreadsheet's data table on the left hand side. However, it would have been nice if you had explained how to derive the line within the dialogue. Just my 2 cents...
This doesn't make sense, if the secound part is about how much and isshe us of the proplem, then it could be any of the defects not just A otherwise it's just the most frequent is the root cause!
i dont uunderstand this at all! like how is this not just a fancy and unneccery way of saying that plie of issues is the largest, lets start with that one. did we really need a diagram to identify largest problem = mostt efficent fix?
I think the answer to your question is that the example is a simplified one for the sake of explaining what the chart is and how it works. In reality, you could have a scenario with many more factors that cause a problem(s) but you don't how many or which ones to focus on so you figure that out by doing this exercise. For example, you could have a scenario in which after you make the chart you learn that 80% of the cause of the problem is caused by 3 factors, rather than just 1, which meet that percentage threshold. Now you know how many and which causes to focus on fixing. With that said, that's my interpretation so take it with a grain of salt.


Learn more with our free online course, “Practical Improvement Science in Health Care: A Roadmap for Getting Results”: harvardx.link/wljmw
Thank you!!
Learned a lot from a short video.
Nice job. No reality TV crap to get in the way of seeing how the pareto works. Thanks
Isn't that obvious that most frequent (bars with highest frequency) defects must be treated first for maximum efficiency?
I mean what value did Pareto chart add to this?
The curved line lets you know at a quick glance which bar has the most bang for buck, and the intersection with the 80% line tells you at what point you need to stop to be able to handle the first 80%.
It’s confusing because of the double y-axis. But the graph at the end tells you that column A + column B add up to 80%.
I agree to a point. However, a pareto chart prevents jumping to the root cause of a problem and its a good visual to share with personnel to see how outages and their improvements help an organization.
Wow!! That was a short, simple and excellent explanation.. Thank You!!
Wow this was fantastic. I used this to understand this chart for my CompTIA Project+ exam. Thanks!
Thank you so much. i learned from this video pareto 📈.
Still don't understand how to read Line in this chart? I understand Bar.
i have the same question .. it´s so different of other videos
I also had the same issue when I first saw this. First you need to know the rules of a Pareto Chart:
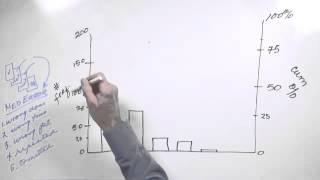
Rule #1: The frequency bars (blue bars above) must have the highest values on the left and decrease accordingly as you move right.
Rule #2: Your percentage line (red dotted line above) must increase to 100% as you continue right.
So, in the graph above, there are two Y-axis. The first one (on the left) has the frequency (how many times a defect occurs) 1-10 occurrences. The other Y-axis (on the right) shows the relative frequency a.k.a. the percentage of occurrence, 1-100%. This percentage represents how much a single defect (a,b,c, or d) occurs compared to the total amount of defects. The blue bars are explained by the y-axis on the left and the line is explained by the y-axis on the right.
For example: from above it looks like there are a total of 20 defects that have occurred. Of those 20 total defects, Defect A occurred 8 times (8/20) = 40%. As you continue right you accumulate (add) the occurrences in order to place your line in the correct location. Continuing....Defect B occurred 5 times out of the total 20 times so...(5/20)=25%. Once the line is at the B defect bar above, the line should be at 40%+25%=65%. You continue this with each bar until you reach 100%. If this unclear I understand. This should not make sense in a youtube comment section.
@@sampat7789 thank you!! the only reason I clicked on this video is to find out what does the line mean yet the video didn't explained it
@@sampat7789 This comment is what made coming to this video worth it.
@@sampat7789 thank you
Wow he made it so simple
This was a clear way for me to understand what a Pareto chart is- thank you so much for the visual!
Simple and short . I really understand this Pareto Chart. Thank you.
Thank you for the explaination!
A question, why is the third axis needed if the y-axis has to be sorted from the highest frequency to the lowest?
Isn't then obvious that the first columnt on the left is the column for the defect which we have to start resolving first to achieve the highest possible impact?
Thanatos you i do undesrtand finally
Why did we use only A? The line intersection ends at b too
This was a great tool. Thank you
Honest question, and semantical I'm sure, but he said that a Pareto Chart has two Axes; and then said "it has a X-axis, a Y-axis, and another X-axis".
Wouldn't that be three Axes? Or because there are two X-axis, those count for 1, & added to the Y-axis, together count as two overall?
Beautifully explained
what is the. line for and how we can compute them sorry but I am new to this
Easily explained and understood. Thank you!
Thank
Why does the frequencies add to more than 100%?
what's with the curve?
Concise and informative. Well articulated!
I can deduce the equation for the line based on a brief view of the spreadsheet's data table on the left hand side. However, it would have been nice if you had explained how to derive the line within the dialogue. Just my 2 cents...
If he did a Pareto chart of reasons why people come to this video, he would have also come to your conclusion.
@@tylerfoster729 Well said
THAT'S AN AWESOME EXPLANATION
Thank you so much for the explanation 👍
Thanks
wow thats better than many 15 mins videos explaining the chart
my stats prof sucks. thanks for explaining
no
This doesn't make sense, if the secound part is about how much and isshe us of the proplem, then it could be any of the defects not just A otherwise it's just the most frequent is the root cause!
Nice graph... Someone might be jobless i guess to discover this
i dont uunderstand this at all! like how is this not just a fancy and unneccery way of saying that plie of issues is the largest, lets start with that one. did we really need a diagram to identify largest problem = mostt efficent fix?
I think the answer to your question is that the example is a simplified one for the sake of explaining what the chart is and how it works.
In reality, you could have a scenario with many more factors that cause a problem(s) but you don't how many or which ones to focus on so you figure that out by doing this exercise.
For example, you could have a scenario in which after you make the chart you learn that 80% of the cause of the problem is caused by 3 factors, rather than just 1, which meet that percentage threshold. Now you know how many and which causes to focus on fixing.
With that said, that's my interpretation so take it with a grain of salt.
hi guys
❤
cmon man next time make sure that cumulatives do not exceed 1
Thanks