Region to State Drill Down with Set Actions

Вставка
- Опубліковано 22 лип 2024
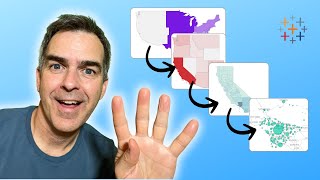
- In this tip, I show you how to use set actions to create a map that allows the user to click on a region and show the states for the region, but keeping all other areas at the region level.
Download the workbook here - www.vizwiz.com/2019/03/region... - Наука та технологія


Brilliant one! Simple and extremely easy to understand! Thank you Andy! 👏
This is an awesome tip, thanks Andy.
Hey Andy, This is very helpful, thank you!
Awesome, I would like to see more examples of this technique in the future if possible. Thanks again
Hi, working with version 2020 3.1.
Everything seems to work because the tooltip shows good drill down values but the map doesn't change and stays on region level, without showing departement under region. However the value is good on the region and correspond to the departement which is under. Why can't i see the cutting by departement on the selected region ?
when i tried to drill down to the city level, only the first city show up on the map. it would not show all the cities. but wjen I use the Text table, it will show up all the cities on the table.
Hi Andy,
Is there a way to do this without using set actions?
Hey Andy. Thank you for this video! Do you know if there is a way to drill down another level to something like Postal Code? I have been unable to get that to work.
If you follow the process in this viz, it should work. public.tableau.com/profile/andy.kriebel#!/vizhome/ScatterplotDrilldownSetActions/ScatterplotDrilldown
Hi Andy, Will this approch work for Region-State-City Hierarchy in a map visual.
I would imagine there’s a way to do it, but I’ve never tried.
Thanks Andy
Any time!
Andy, great video...thanks for putting this together! I tried doing something similar, except for State to County, following your instructions step-by-step, but couldn't get it to work. Any suggestions or resources you could point me to?
Did you set up the dashboard action? You have to make that separately from the worksheet action.
@@vizwiz Yessir...I did that one as well. If I click on the + next to State (in the Marks pain) it will show the counties, but when I click on a state, it doesn't drill down to the counties in that state.
@@vizwiz I am having the same issue too
@@johna9214 if you’re having an issue then something must be getting missed along the way
Hi, thank you for the video I applied it and it worked fine in the dashboard but once I used it in the "story" the drill down action disappeared Is there a solution ?
Set Actions must not work in stories then. I’ve never tried as I never use story points.
Hi Andy, Can we have same Tableau Map layout for City view? Just like Province it shows a specific shape but when I add City, it shows circle on map.
Tableau doesn't know city shapes. It does know counties though. City cannot be filled maps.
@@vizwiz - Thank you Andy! Could you share some more information on Spatial file? How to get those data for City of Canada?
Hi,
How can we further drill-down from State to City & City to Sub-City in the same view?
I would do it with dynamic zone visibility. Here’s an example of 2 levels. More levels just need more calculation.
ua-cam.com/video/BsP1hIXLV64/v-deo.html
Hey Andy, your videos are awesome, technically you are my teacher. I just like to ask you is it possible to do it otherwise, if I select state from filter then only corresponding relevant region should show in the visuals? I'm stuck here, please help. Thanks in advance
Yes, it’s definitely possible. I can’t think of the calculation immediately though.
@@vizwiz - I'm selecting State value through filter and in turn I want a view for all other states from the region to which the selected state belongs. I hope you can guide us. Thanks!
👍👍
Lucked in to this. Well done!
Awesome work!!!
Hey Andy is it also possible to make the map zoom in On the state you clicked?
If you filter the view as well, you could.
@@vizwiz Hi Andy how can I filter the view?? Please let me know
Hi Andy, I am not getting the Change Set values under Action
This is available in 2018.3 onwards i believe.
Andy, I tried to play around with the Sales by State Analysis Project on your Tableau web, and as soon as I add the In Selected State card onto the marks, it shows only one state instead of 5. Am I missing something? All calculations are correct. Marek
Marek you’re set action must not be set up correctly. Double check it against how mine is setup.
Andy Kriebel I already did, but will recheck. Thank you for the quick response. Much appreciated.
Andy Kriebel Found the mistake; thank you!!!
@@marek19 What was the mistake can you please help facing same issue