"When I see a variable in an exponent, I try to use logarithm as a ladder so that I can bring them off their shelf" is a poetically quote-worthy sentence.
Mimizing the sum of squares is not equivalent to minimizing the sum of absolute deviations. This is easiest to see if you try to just fit a single constant c to the data, i.e. minimize sum(|x-c|) vs sum((x-c)^2). In the former case, you get the median, whereas in the latter case, you get the mean. Generalized to curve-fitting, minimizing the sum of absolute deviations is called "least absolute deviation" fitting, which is different from "least squares". (Statistically, "least absolute deviation" can be interpreted as assuming that the errors are Laplace-distributed, while "least squares" can be interpreted as assuming that the errors are normally distributed.)
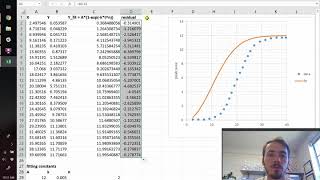
The method of raw data -> manipulation to make linear -> least squares fit -> post-analysis to recover actual fit parameters is something that I've used several times, and it's a life saver every time. However, it's important to note that you're no longer just minimizing the squared deviation, and the amount that the error matters can become unequally weighted. As an example, an exponential function can be manipulated to be linear through a logarithm, such that y=Ae^Bx becomes ln(y) = ln(A) + Bx. Fitting to this line to the data using least squares will minimize the squared deviation between ln(y) and ln(data). The result is that larger data points are relatively less important to the fit than smaller data points. Say you have the points (1,2) and (10,200) in your data set and your least squares fit gives you the points (1,1) and (10,100) on the best fit line. The x=1 point has a real squared deviation of 1, and the x=10 point has a squared deviation of 1,000. However, the deviation used in the manipulated least squares fit is on ln(y), which gives the x=1 point a squared deviation of ln(2)^2=0.48, and the x=10 point a squared deviation of ln(200/100)^2=0.48... The same weighting. In this case, the error is weighted using fractional error, and since these are both 2x the fit line, they have the same error as far as the least squares fitting is concerned. This weighted error fitting can be desirable or not, depending on your use case. Just something I've noticed through use, and thought it might me useful to someone else. :)
@@nachopuma13 I'm not sure that you really should do anything to "correct" for this, since it's the fractional error that's really important for exponents - it's just something to keep in mind. If you look up the wikipedia page on "Propagation of uncertainty", they give a very mathy description of errors/uncertainty. If you can follow it, that may give you more of an understanding of the "correct" way to quantify errors for different applications.
Very good point! One little thing I'd like to add: If the raw data y_i follow an exponential function exp(x_i) plus some normally distributed error, then for small values of exp(x_i) some of the corresponding y_i might be negative. In that case, you can't even compute ln(y_i) for all i.
Aside from the flaw others already have pointed out it’s a really well made video and broadened my horizon for the Least Squares method which so far I had only applied to lines 👍🏼
yeah ... or for some reason excel also knew how to make a polynomial fit and gave you an R^2 value .... and how would you do that if your system is nonlinear.... hehehe :-D. Try to tell excel is wrong. And yes luckily excel doesnt tell you what it does so you can trust in it and dont need to hear about all the stuff around simple linear regression is wrong thing
Great video. Essentially just expanding early statistics formulas and changing meaning of operation to fit new context. Example Error is effectively variance. There is always beauty in expanding the usability of the tools we already have. There is a great spirograph video someone came out with recently that absolutely blew my mind.
Very nice video. I`m personally teaching least square regression to my colleagues with a similar approach. I agree with the comments, but don`t take it personally. There is too much stuff on this subject for a 12 min video, so I understand the need for some simplifications. That will give you a reason to do a part 2, where you`ll be able to refine and go further. One thing I would like you to consider is to warn your audience about the danger of using X transpose X form of the normal equation. With a lot of data points, numerical instabilities can occur. One thing also that can interest your audience is to show them some examples with a specific tool like Matlab/Octave/Excel/OpenOffice. They have specialized functions for least square regression which are not as well known as you might think. Another topic that you can add to your list is the uncertainty estimation of the estimated parameters. This is often neglected and it is very important to have an idea how well you can know the parameters. I`m encouraging you to continue. You have a gold mine in your hand. Good luck!
The correct motivation for least squares is the Gaussian error model. The probability of error e goes like exp(-C e^2), and so the total probability density for all the errors is the product of these exponentials, or exp( - weighted sum of squares ). Minimizing the square deviation is the same as maximizing the probability of getting the data given your model. This is the Bayesian rule for finding the most likely possibility for the parameter values.
You are referring to the Maximum Likelihood estimator, which happens to give the exact same estimator as OLS in the case of linear models. The “motivation” in OLS is indeed minimizing the square of the residuals, as he shows on the video
@@annaclarafenyo8185 Oh so you were there? hahah It has been reinvented many times, legendre published it from an algebraic/geometric point of view in 1805, Gauss came with his statistical interpretation in 1809. But anything that explains why a method is useful or interesting is motivation. Gauss motivates it slightly differently from legendre. Linear algebra/geometry textbooks motivate it differently from statistics textbooks. All is correct motivation.
I'm glad you liked it - and better yet that you took it a step further! It's been a super useful tool for me here recently. I am currently working on some other videos, but the time it takes to produce them greatly outweighs my free time at the moment D: Stay tuned!
Where was your video 3months ago because i was needed it soooo much then I was working on fitting covid data with SEIR model I hope you do more videos on that topic
At 3:47, the equations after setting derivatives to 0 being linear in coefficients in m and b are a direct result of the expected function (here f(x) = mx + b) being linear in m and b. If the expected function was non linear in m or b, those equations would have been non linear too such as for f(x) = m^2 *X + mx +b or f(x) = e^(mx) + b
Just to echo the comment already made, minimizing squared deviations is NOT THE SAME as minimizing absolute deviations. Minimizing squared deviations provides an estimator for the mean of y given x. Minimizing absolute deviations provides as estimator for the median of y given x. Other properties also differ across approaches, for example mean squared error is much more sensitive to outliers.
so it's possible to use this in parameter estimation of consants in ode models? but instead numerical integration is used?instead of a functional relation
if you know that your ode is linear in your parameters, then why not ... ! though typically youd do numerical integration exaactly when your system is nonlinear. FFT and alike stuff from generalised fourier series is also linear algebra. But generally parameters in odes do not linearly influence the numerical result. This approach here generally only works because youd assume that x or t are without errors and that you have constant basis ("shape") functions (phi(x) or phi(t)). If you have phi(n)=f(-Lamda(n)*t) and you want to determine the lambda(n)s then you are typically out of luck when using ode integration, not even talking about finite difference precision or numerical errors. I tried this once with full blown nonlinear optimization to data and I remember it was even so that the lambdas where jumping between the n's so I think youd need to constrain the lambdas. For bvps even the tau method will not produce very accurate results. And obviously you cannot make a linear system out of it. Now this is only about simulation.... if you want to fit to data then you are even more in trouble Some stuff that you might try is dynamic mode decomposition, though even that works only for some of the x'=A*x systems. And that one is a linear ode (in x) which exactly gives you a sum of exponential functions with lambda(n)s as eigenvalues
@@sschmachtel8963 Thanks for this input i've only just seen your comments now. The models I'm interested in fitting parameter (constants in the model) to, are always many 1st ORDER non-linear DE's and sometimes (DAE's with terms such as dy1/dt=y3*(dy2/dt)^2). Often they are non linear in parameters within the DE's making fitting more complicated. I've tried to investigate Dynamic mode decom but didn't get very far as i don't fully understand it. Despite there being many state variables y1,...y6 typically the data consists of 3 variables y1(t) -stress, y2(t) -strain, y3(t) -damage variable. typically the equations form a regular shape, therefore im looking for a method can basically simplifies the model and help fits data any ideas?
Yeah, this video was a bit rushed so I could make the SoME1 deadline. Looks like I accidentally cut out a few sentences that were supposed to setup the last example. D:
Everyone getting nitpicky about "least absolute deviation" versus "least squares deviation" are missing the point, I think. Sure, he might have said that there's no difference, but the conceptual (and important) part as it relates to this video is that minimizing either one will minimize the error in some sense. For the general audience this video is intended for, this is plenty of confirmation to accept that using least squares deviation is valid.
Yeah I've seen worse examples of intentional simplifications in many undergrad-level university courses. Only thing that I think personally should've been there is a sidenote/postscript saying that the statement wasn't fully true for all cases. That's all that's needed for this scope.
yeah exactly ... if you consider that it is not all too common to even talk about that standard linear regression assumes that the x vector is completely without errors ... And if x is without errors, then surely phi(x) is, too. So talking about errors in x doesnt really make sense since the basic linear regression doesnt consider those at all. There is lots of stuff that one has to be pretty precise about... And in the end practical applycation is pretty important as well... bec what does it help you if you know you would need to apply error correction to x and y in a nonlinear function, if you completely fail to find suiting initial guesses and your fit wont converge at all. And yes if you know how to do it, you could preinitialise your x0 and errors with the linear solution such that you can start nonlinear optimization from there ... that works as well
yeah and try this to sell to your fellow non mathematicians. They think you are crazy because of course the exponential function is not linear. And neither do they know that for standard linear regression you assume that x is without any error. And neither that if you assume that x is not free of errors, you cannot really anymore compensate for any nonlinearities of the basis funcitons, whilst for truely linear regression there are still ways in many of the cases. To put it short people dont know what the word linear means. And that for determining the Cs it is enough that the overall funciton is linear in C. It gets esepcially difficult if you talk about linear differential equations. If you start to use such tricks they will try to grill you. And when they find out that they were wrong they also find out that oh ... you assumed that x is without errors? "You are wrong anyway and I was right" Yeah sure. Extremely useful is also the Tau method for linear odes combined with sturm liouville, That is you reformulate odes in terms of orthogonal basis functions and truncate. Much better than power series approaches. Linear is King in so many ways
I’m trying to learn least squares as a software developer, but a lot of the symbols and terminology used in this video are way over my head. What prerequisite knowledge is required to grasp least squares?
You speak of discontinuity, and it is somewhat clear what you mean by that by looking at the pictures, but where does it come from? And what does squaring have to do with it?
You had an expression that you wanted to derivate, but it wasn't derivable because it had sharp corners or discontinuities. Turns out that in this case, the square of that function IS derivable, and you can stay with the square of the function because it didn't change the property that you were interested in (the position of its minimum value).
Too much algebra not supported by enough geometrical intuition. Sure it's cool to discover that the algebra works, but that is something you need to do yourself with pen and paper. It's not suitable for a video.
The intuition I like for this method is that, the solution Xc is an orthogonal projection of y onto X's column space, a space y doesn't really belong to, but an orthogonal projection grants the shortest distance between data and model.


![ОРБАН приехал к ПУТИНУ и "отчитался" о поездке в Киев 😁 [Пародия]](http://i.ytimg.com/vi/_0ukDovOWq8/mqdefault.jpg)

"When I see a variable in an exponent, I try to use logarithm as a ladder so that I can bring them off their shelf" is a poetically quote-worthy sentence.
I like it. Must memorize.
Mimizing the sum of squares is not equivalent to minimizing the sum of absolute deviations. This is easiest to see if you try to just fit a single constant c to the data, i.e. minimize sum(|x-c|) vs sum((x-c)^2). In the former case, you get the median, whereas in the latter case, you get the mean. Generalized to curve-fitting, minimizing the sum of absolute deviations is called "least absolute deviation" fitting, which is different from "least squares". (Statistically, "least absolute deviation" can be interpreted as assuming that the errors are Laplace-distributed, while "least squares" can be interpreted as assuming that the errors are normally distributed.)
The method of
raw data -> manipulation to make linear -> least squares fit -> post-analysis to recover actual fit parameters
is something that I've used several times, and it's a life saver every time. However, it's important to note that you're no longer just minimizing the squared deviation, and the amount that the error matters can become unequally weighted.
As an example, an exponential function can be manipulated to be linear through a logarithm, such that y=Ae^Bx becomes ln(y) = ln(A) + Bx. Fitting to this line to the data using least squares will minimize the squared deviation between ln(y) and ln(data). The result is that larger data points are relatively less important to the fit than smaller data points. Say you have the points (1,2) and (10,200) in your data set and your least squares fit gives you the points (1,1) and (10,100) on the best fit line. The x=1 point has a real squared deviation of 1, and the x=10 point has a squared deviation of 1,000. However, the deviation used in the manipulated least squares fit is on ln(y), which gives the x=1 point a squared deviation of ln(2)^2=0.48, and the x=10 point a squared deviation of ln(200/100)^2=0.48... The same weighting. In this case, the error is weighted using fractional error, and since these are both 2x the fit line, they have the same error as far as the least squares fitting is concerned.
This weighted error fitting can be desirable or not, depending on your use case. Just something I've noticed through use, and thought it might me useful to someone else. :)
very true!
I noticed this a while ago, do you know of any modification or alternate method that takes into account such problem?
@@nachopuma13 I'm not sure that you really should do anything to "correct" for this, since it's the fractional error that's really important for exponents - it's just something to keep in mind.
If you look up the wikipedia page on "Propagation of uncertainty", they give a very mathy description of errors/uncertainty. If you can follow it, that may give you more of an understanding of the "correct" way to quantify errors for different applications.
Huh. I was aware this was possible, but have been slightly reckless about it. Good point, tho.
Very good point!
One little thing I'd like to add: If the raw data y_i follow an exponential function exp(x_i) plus some normally distributed error, then for small values of exp(x_i) some of the corresponding y_i might be negative. In that case, you can't even compute ln(y_i) for all i.
Aside from the flaw others already have pointed out it’s a really well made video and broadened my horizon for the Least Squares method which so far I had only applied to lines 👍🏼
yeah ... or for some reason excel also knew how to make a polynomial fit and gave you an R^2 value .... and how would you do that if your system is nonlinear.... hehehe :-D. Try to tell excel is wrong. And yes luckily excel doesnt tell you what it does so you can trust in it and dont need to hear about all the stuff around simple linear regression is wrong thing
Great video. Essentially just expanding early statistics formulas and changing meaning of operation to fit new context. Example Error is effectively variance. There is always beauty in expanding the usability of the tools we already have. There is a great spirograph video someone came out with recently that absolutely blew my mind.
whatever you did here, its beautiful. very good explanation, and I hope to see more !
Very nice video. I`m personally teaching least square regression to my colleagues with a similar approach. I agree with the comments, but don`t take it personally. There is too much stuff on this subject for a 12 min video, so I understand the need for some simplifications. That will give you a reason to do a part 2, where you`ll be able to refine and go further. One thing I would like you to consider is to warn your audience about the danger of using X transpose X form of the normal equation. With a lot of data points, numerical instabilities can occur. One thing also that can interest your audience is to show them some examples with a specific tool like Matlab/Octave/Excel/OpenOffice. They have specialized functions for least square regression which are not as well known as you might think. Another topic that you can add to your list is the uncertainty estimation of the estimated parameters. This is often neglected and it is very important to have an idea how well you can know the parameters. I`m encouraging you to continue. You have a gold mine in your hand. Good luck!
Thank you, this video helped me a lot. Also, really nice editing. Hoping to see more videos!
The correct motivation for least squares is the Gaussian error model. The probability of error e goes like exp(-C e^2), and so the total probability density for all the errors is the product of these exponentials, or exp( - weighted sum of squares ). Minimizing the square deviation is the same as maximizing the probability of getting the data given your model. This is the Bayesian rule for finding the most likely possibility for the parameter values.
There is no such thing as "the correct motivation".
You are referring to the Maximum Likelihood estimator, which happens to give the exact same estimator as OLS in the case of linear models. The “motivation” in OLS is indeed minimizing the square of the residuals, as he shows on the video
@@jensrenders4994 And by example, I demonstrate you are wrong.
@@lucascisneros8147 You don't know the motivation, because you weren't there when it was invented. It is a Bayesian method in disguise.
@@annaclarafenyo8185 Oh so you were there? hahah
It has been reinvented many times, legendre published it from an algebraic/geometric point of view in 1805, Gauss came with his statistical interpretation in 1809. But anything that explains why a method is useful or interesting is motivation. Gauss motivates it slightly differently from legendre. Linear algebra/geometry textbooks motivate it differently from statistics textbooks. All is correct motivation.
thank you so much for explaining this. Cheers!
I really enjoyed this video, and it inspired me to write a little python program to implement it. Thank you for sharing.
I'm glad you liked it - and better yet that you took it a step further! It's been a super useful tool for me here recently. I am currently working on some other videos, but the time it takes to produce them greatly outweighs my free time at the moment D: Stay tuned!
It is a very useful video, thank you!
Really good video!
Outstanding.
thanks pal, helped me out
this was soo good!
omg wow, that was amazing
nice video mate!
Where was your video 3months ago because i was needed it soooo much then
I was working on fitting covid data with SEIR model
I hope you do more videos on that topic
awesome!!
make such more videos 😃
Excellent vidoeo
At 3:47, the equations after setting derivatives to 0 being linear in coefficients in m and b are a direct result of the expected function (here f(x) = mx + b) being linear in m and b. If the expected function was non linear in m or b, those equations would have been non linear too such as for f(x) = m^2 *X + mx +b or f(x) = e^(mx) + b
Just to echo the comment already made, minimizing squared deviations is NOT THE SAME as minimizing absolute deviations. Minimizing squared deviations provides an estimator for the mean of y given x. Minimizing absolute deviations provides as estimator for the median of y given x. Other properties also differ across approaches, for example mean squared error is much more sensitive to outliers.
I KNEW I HAD HEARD THIS VOICE ALREADY!! Are you quantum boy? :))
Thanks nice video
So, what are you doing with the varactors?
so it's possible to use this in parameter estimation of consants in ode models? but instead numerical integration is used?instead of a functional relation
if you know that your ode is linear in your parameters, then why not ... ! though typically youd do numerical integration exaactly when your system is nonlinear. FFT and alike stuff from generalised fourier series is also linear algebra.
But generally parameters in odes do not linearly influence the numerical result.
This approach here generally only works because youd assume that x or t are without errors and that you have constant basis ("shape") functions (phi(x) or phi(t)). If you have phi(n)=f(-Lamda(n)*t) and you want to determine the lambda(n)s then you are typically out of luck when using ode integration, not even talking about finite difference precision or numerical errors.
I tried this once with full blown nonlinear optimization to data and I remember it was even so that the lambdas where jumping between the n's so I think youd need to constrain the lambdas.
For bvps even the tau method will not produce very accurate results. And obviously you cannot make a linear system out of it. Now this is only about simulation.... if you want to fit to data then you are even more in trouble
Some stuff that you might try is dynamic mode decomposition, though even that works only for some of the x'=A*x systems. And that one is a linear ode (in x) which exactly gives you a sum of exponential functions with lambda(n)s as eigenvalues
@@sschmachtel8963 Thanks for this input i've only just seen your comments now.
The models I'm interested in fitting parameter (constants in the model) to, are always many 1st ORDER non-linear DE's and sometimes (DAE's with terms such as dy1/dt=y3*(dy2/dt)^2). Often they are non linear in parameters within the DE's making fitting more complicated. I've tried to investigate Dynamic mode decom but didn't get very far as i don't fully understand it.
Despite there being many state variables y1,...y6
typically the data consists of 3 variables y1(t) -stress, y2(t) -strain, y3(t) -damage variable.
typically the equations form a regular shape, therefore im looking for a method can basically simplifies the model and help fits data any ideas?
Chebyshev polynomials mentioned
What is the software that are you using to make this videos ?
Probably the same as 3b1b uses, available in his Q&A
Did the video do an abrupt cut at ~ 10:32?
Yeah, this video was a bit rushed so I could make the SoME1 deadline. Looks like I accidentally cut out a few sentences that were supposed to setup the last example. D:
Everyone getting nitpicky about "least absolute deviation" versus "least squares deviation" are missing the point, I think. Sure, he might have said that there's no difference, but the conceptual (and important) part as it relates to this video is that minimizing either one will minimize the error in some sense. For the general audience this video is intended for, this is plenty of confirmation to accept that using least squares deviation is valid.
Yeah I've seen worse examples of intentional simplifications in many undergrad-level university courses. Only thing that I think personally should've been there is a sidenote/postscript saying that the statement wasn't fully true for all cases. That's all that's needed for this scope.
yeah exactly ... if you consider that it is not all too common to even talk about that standard linear regression assumes that the x vector is completely without errors ...
And if x is without errors, then surely phi(x) is, too. So talking about errors in x doesnt really make sense since the basic linear regression doesnt consider those at all. There is lots of stuff that one has to be pretty precise about...
And in the end practical applycation is pretty important as well... bec what does it help you if you know you would need to apply error correction to x and y in a nonlinear function, if you completely fail to find suiting initial guesses and your fit wont converge at all. And yes if you know how to do it, you could preinitialise your x0 and errors with the linear solution such that you can start nonlinear optimization from there ... that works as well
what happened at 10:30 ?
yeah and try this to sell to your fellow non mathematicians. They think you are crazy because of course the exponential function is not linear. And neither do they know that for standard linear regression you assume that x is without any error.
And neither that if you assume that x is not free of errors, you cannot really anymore compensate for any nonlinearities of the basis funcitons, whilst for truely linear regression there are still ways in many of the cases.
To put it short people dont know what the word linear means. And that for determining the Cs it is enough that the overall funciton is linear in C. It gets esepcially difficult if you talk about linear differential equations.
If you start to use such tricks they will try to grill you. And when they find out that they were wrong they also find out that oh ... you assumed that x is without errors? "You are wrong anyway and I was right" Yeah sure.
Extremely useful is also the Tau method for linear odes combined with sturm liouville, That is you reformulate odes in terms of orthogonal basis functions and truncate. Much better than power series approaches.
Linear is King in so many ways
Too advanced for me, but looks really good!
I always wonder how Steinhart and Hart came up with their model for negative temperature coefficient thermistors, in 1968 without computers…
I’m trying to learn least squares as a software developer, but a lot of the symbols and terminology used in this video are way over my head. What prerequisite knowledge is required to grasp least squares?
Did not get why you square the formula and what that does.
At all.
You speak of discontinuity, and it is somewhat clear what you mean by that by looking at the pictures, but where does it come from? And what does squaring have to do with it?
You had an expression that you wanted to derivate, but it wasn't derivable because it had sharp corners or discontinuities. Turns out that in this case, the square of that function IS derivable, and you can stay with the square of the function because it didn't change the property that you were interested in (the position of its minimum value).
This is a bit misleading. Least absolute deviation (LAD) gives different results than least squares.
Too much algebra not supported by enough geometrical intuition. Sure it's cool to discover that the algebra works, but that is something you need to do yourself with pen and paper. It's not suitable for a video.
The intuition I like for this method is that, the solution Xc is an orthogonal projection of y onto X's column space, a space y doesn't really belong to, but an orthogonal projection grants the shortest distance between data and model.
@@nachopuma13 Me too. That is how statistics works.