Great video! I’m still trying to grasp the concept of price on spreads relative to volatility skew. This video will be on repeat lol. Thank you again for all that you do.
Great video! One thing to clarify here though: The spreads you refer to in the video all seem to be debit spreads where you buy the closer to the money option and sell the farther out of the money option, hence resulting in cheaper spread because farther option is more expensive due to higher IV -> resulting in a cheaper spread indicating the direction of volatility skew. If you wanted to sell the spreads, basically do credit spreads, the reverse would be what you should be looking for, right? You are selling the near option, buying the farther out strike option. In this case credit spreads would be cheaper in the direction of the volatility.
12:50 Ok, Puts are in higher demand on downside volatility skew making them more expensive. When a spread is in place, the spread is more expensive on the call side, does this mean it's better value to purchase the PUTS? and how can this be true if puts are in higher demand, making them more expensive? Great video btw but pls lmk
great vid, nicely covered, but here's the rub: in the downside (reverse) skew example w/ 2310 put @ 10% vol vs 2260 put @ 11.7% vol - 10 vol, although lower in absolute terms than 11.7 can be expensive in relative value terms, as well as 2310 call @ 8.5% vol can be relatively cheaper vs 2360 call @ 7.7% vol. Because just like a $100 stock > $25 stock, the $100 stock can be in a lower %ile range of its relevant lookback period while $25 stock can be @ the higher %ile end. So too, vol surface (skew + term structure) is same - vol is relative to itself as well as other points on the surface as each delta & tenor need to compare its current IV vs historical IV ie., 10% vol can be in 90th percentile for that particular delta/tenor while 11.7% can be in the 10th percentile for its own particular delta/tenor
The example at approx. 3:00 fails to take into account that the SPY was scheduled to go ex-dividend on March 17, which just happens to be 35 DTE from the Feb 9th date in the example. All else equal, a put and call at same strike will differ in price by the expected dividend plus/minus the strike vs. underlying price delta. This more than explains the $24 vs. $29 prices.
If I may ask a few questions please - 1) You said VIX is IV on 30 days SPX options. that's what I read on google. But in increasing market - Volatility would increase ( not based on direction - just a measure of SD guage ) so I would assume IV on 30 day SPX options would increase too ? but as we know VIX generally tanks. What am I missing ? 2) of all the different IV's ( across the strike chain and across day to expiration ) - how is the stock IV calculated using these numbers ? I always heard people mention it is calculated using option IV but never really found ( I admit I have not looked thoroughly ) the calculation using all these IV's . If you could kindly give a url or something ? 3) IV and option price seem like the chicken and egg problem. Don't option prices require IV ? How do brokers get the option prices so readily - there has to be an automated way for them to get IV to feed for option prices across the chain. Why don't we use that method to gauge IV rather back calculate using option price ? Sorry if a little lengthy but would appreciate your kind attention a ton and more! thanks!
1) What do you mean by volatility is always increasing in a rising market? In terms of implied volatility (option prices), we typically see falling implied volatility as markets are rising, as there's more complacency and very little fear in a rising market. The VIX could increase with market increases (especially with a strong breakout to new highs), but is much less common to observe. Also, keep in mind that implied volatility is just a number that quantifies option prices (said simply). When traders bid up option prices (to speculate or hedge), the increase in the option prices causes an increase in implied volatility (all else equal). 2) The overall implied volatility you see in each respective option chain takes into account the prices/implied volatility of the options in that expiration cycle. I don't have the exact calculation (it's likely complicated) and may vary by broker. 3) IV and option prices always create interesting discussions. However, IV changes as a result of supply/demand for options. If everyone in the market rushed to buy every option in site, we'd see a large-scale increase in option prices and also implied volatility. However, you could make the argument that IV also "drives" option prices, as really low or really high levels of implied volatility could cause traders to buy/sell options based on an assumption that the IV would revert from its current level. Brokers have live data feeds for their option price quotes, and then from there, the broker calculates Greeks/IV themselves (to my knowledge). I hope this helps!
thanks so much for the reply! regarding 1) I meant that Volatility is merely Standard deviation which is not affected by the direction of the price move rather the abs. move itself. So, if the market is rising pretty fast the SD hence volatility should be higher by conventional definition ? We both agree VIX decreases in this scenario. question is does SD increase in rising markets hence does Volatility increase? Sorry, if I am out of logic here - I am kind of new but I really think there is a break in volatility and IV in case of rising markets where volatility/SD increases but IV decreases irrespectively.
Hi Chris, quick question; if for down skewed security if the vol skew widens would that mean market is likely to go up and if spread contracts it's more likely to go down?
Hi Ankit! Could you rephrase your question, please? I am not quite sure what you are asking. The volatility skew itself does not tell us which direction the market is likely to go. There isn't anything we can look at to determine the more likely direction of a stock's movement. Volatility skew tells us where the market is pricing in the most risk/likelihood of a bigger movement. In a product like VXX or UVXY, significant short-term increases are more likely than significant short-term increases, since the VIX Index/futures typically experience short-term explosions to the upside when the market falls. In a product like the S&P 500, the market typically heads higher in a slow manner and falls violently (as we've seen recently), which is why the S&P 500 has downside volatility skew (puts are more expensive/trade at higher implied volatilities than calls at equal distances from the current market price). But just because there is downside volatility skew, it doesn't mean the market is more likely to decrease than increase. All downside volatility skew tells us is that a larger movement to the downside is more likely than the same magnitude of movement to the upside (for example, a one-day decrease of 3% is more likely than a one-day increase of 3%, at least based on historical market movement statistics). I hope this helps/makes sense! -Chris
Thanks Chris. So what I mean is say the typical downward skew of an index is 1.2 ( considering OTM options). This means that put vol is 20% higher than call. Now say this ratio changes to 1.5 or 1, does that mean anything? My gut is that it tells you where the stronger hands in market are inclined towards. But happy to be corrected.
Great video. Thanks for making it. I'm reading "The Option Trader's Hedge Fund" right now. That book discusses the importance of IV skew and using it as an edge. Your video helped put a visual to it. I've been trading options frequently for over a year now. My success rate is so much better now compared to when I was trading stocks alone. IV is a key edge. Thanks again.
jgfunk hey friend can you please suggest how to potentially use IV skew on trading? It's our specific to a certain strategy or is there a generic best practice?
Does the skew predict the price direction? So, if IV in puts is higher than in calls, would that mean that market participants expect the underlying to go higher or lower? I always thought when IV is higher in puts, people anticipate a move down in the underlying. Is that correct?
Hi Sergei, It doesn't necessarily predict the future price direction, but it does tell us where the market is pricing in the greatest risk. For stocks, especially stock market index products like the S&P 500, the primary risk is to the downside because the most common investment position is to own shares of stock. But just because the risk is priced into one direction, it does not mean that the underlying WILL move in that direction, it's just where the largest risk lies for those exposed to those products. Instead of "risk," we can also think of it as the greater likelihood of a BIG move. In the stock market, it's typically more likely to see the S&P 500 down 5% in one day than up 5% in one day. As they say, "the market takes the stairs up and the elevator shaft down." The expensive put prices relative to call prices reflect that belief (downside skew). In volatility products like the VIX Index or VXXB, it's much more likely to see these products increase by 50% in one day as opposed to decreasing 50% in one day, which explains why the puts are cheaper than the calls on these products (upside skew). I hope this helps! Let me know if you have any follow-up questions. -Chris
Greetings from Brazil. First of all, amazing videos Chris! Great explanations. I used to work as a derivatives broker in a local bank, and I have some doubts. Almost all of the equities in the Brazilian market have a very skewed shape in its volatility chart. In addition, most of the stock's options have low liquidity and sometimes they don't even have enough volume in a daily basis to keep an updated option chain. In this case, what are the main approaches to estimate implied vol and skew when you got no data? Is there any modeling that could generate a reliable volatility surface? And have you ever seen someone gauging the skew with open interest and volume data? HV is generally very off and the market tends to add a very high premium due to illiquidity and the shapes sometimes are not "smooth".
Hi Raphael, Thanks for the comment! To get accurate skew data, we need accurate option price data. Without any trading volume in the options, there's no way to no the "fair" price for that option based on all the activity from market participants. With that said, without liquid options, any skew information is not that valuable (garbage in, garbage out type of situation). Do the stocks you're looking at mostly have downside volatility skew? If so, that's normal since the general population's risk is to the downside because they own shares of stock, and buying puts is one way to reduce that risk. It's impossible to get skew from volume/OI because those figures tell us nothing about the prices of the options we're looking at. To get accurate skew information, we need option prices. I hope this helps! -Chris
@@projectfinance Tks for the reply, Chris. What intrigues me is how market makers price an illiquid option. Since there are no prices on the screen for these options, what usually happens is that the buy side calls a market maker and he gives him a spread. Maybe the mm just get an average HV from the main index and add huge spreads to compose the bid/ask prices. Or get the HV from different markets and from a basket of companies in the same sector. Nevertheless, it's a very poor proxy and it does not rid them to at least estimate the shape of the skewness of the stock in question (you still need an average price to add the spread). With that said, maybe a similar scenario in the US market would be for long expiration options, that has significantly lower liquidity than the short ones, even though sometimes you can see some trades occurring.
Hi Chris, I have a few questions: 1. Is there a way to measure Volatility Skew of an underlying? Is there a way to see that in TOS? 2. When you see SPX for example getting more or less skewed, how does that affect your placing trades based on your 3rd observation? Sell more Call Spreads when it skews to the downside more? Thanks!
Hi Herman, Yes, advanced options traders typically look at the "volatility smile" or "volatility smirk" of a stock's options, which is essentially the IV of each strike price plotted onto a chart, which usually looks like the shape of a smile/smirk: www.investopedia.com/terms/v/volatilitysmile.asp I believe there's a way to see the chart on TOS at the bottom of the trade page, but I'm not sure how as I don't use the platform anymore. I don't actively track skew as I follow a pretty simple options-selling strategy on SPX and don't enter/exit trades based on volatility skew. However, I think it's worth understanding what volatility skew is and why it exists, which is why I made this video. Best regards, Chris
@@projectfinance Top down would be looking at a potential trade from three perspectives: 1. what is/are general market conditions - bullish or bearish 2. what is the condition of sector that the underlying security - bullish or bearish 3. what is the condition of the underlying security - bullish or bearish
Got it. Personally, I don't use any screening because I trade the same two underlyings/strategies and don't need to do any scanning for additional stocks.
Justin, I personally wouldn't trade the stock since it is only $6 and there's not much you can do with the options in there (only premium is at-the-money). The good thing about options trading is that you have complete control over what you trade. In my case, I only trade a small handful of stocks/products these days. -Chris
Something is missing!! Risk to downside=more puts in demand=expensive puts but the video states in the end #3 call spread & put spread section___expensive put spread at upside volatility. What am i missing and i am talking only in terms of market to volatality relation. Anyone please clear this
Hi Divyajeet! The difference is the products that were being analyzed in each section. Equity index products such as the SPX Index (S&P 500 Index) have downside volatility skew (puts more expensive than calls at similar distances from the stock price) because all of the risk lies with market declines. Most people own stocks, so they are prone to losses when the stock falls. Therefore, put purchases are natural and drive up put prices more than calls. Regarding volatility products like VXX, the value of VXX will surge if the stock market falls, which means VXX has big risk to the upside. Therefore, call purchases are natural as hedges and the calls get more expensive than puts at similar distances from the stock price. So, the volatility skew or risk is not always to the downside like it is for equity index products. Sometimes, if a product's movement potential is greater to the upside, the calls will be more expensive than puts at similar distances from the stock price (upside volatility skew). I hope this helps. -Chris
Great video. One question: on equities bull call spreads are more expensive than bear put spreads. Now are bear call spreads less expensive than bull put spreads? Because now you’d be shorting the higher vol options.
It doesn't matter whether you're buying or selling a spread, the price applies to both buying and selling the spread. If the call spread you're analyzing is trading at a higher price than the put spread you're analyzing, you'll pay (collect) more for buying (selling) the call spread compared to buying/selling the put spread.
projectoption thank you for your response. This means that I’ll collect more premium by taking a bull put spread than a bear call spread if I read this right?
While this is very useful info, I wonder how to use it for trading. So on the call and put spread example I will trade one of them based on my directional view and not because one is cheaper over other right?
Hi Ankit, You're correct. This video was more on the educational side and not necessarily suggesting one trade is better than the other. When trading options, the position you trade should always reflect your outlook on the stock's future price movements (or lack of movement). -Chris
Today, the $SPX is trading at 2782, the VIX is at 12.12 the SPX option Skew is north of 142....is this pricing in, or indicating growing FEAR of a sharp market correction.....I would have thought, if the market was not fearful of such, the SKEW would be below 120......welcome comments from an OPTION pro...thanks...Don
First comment, please correct me if I'm wrong: the different option prices for different strikes don't imply anything to do with volatility skew (as you state at the start): even if each option had the SAME % IV, they would have different prices. Please re-listen to the start of your video, as it's wrong.
Thanks! To see volatility per strike in thinkorswim, head to the trade page of the product you want to see skew for. Then, scroll to the bottom and click on the "Product Depth" tab. From there, select the expiration cycle you want to see skew for and you'll be able to see the IV per strike for calls and puts.
Also not true on perceived risk discussion: with "everyone" long stocks, as you know, they use puts to hedge. If they/money managers used options primarily as the form to go long, then we could compare that way
You don't have to use options to hedge options. You can use options to hedge stocks. It doesn't matter if they are long via stocks or calls. Puts can be used to hedge both. Although everyone being long via calls would result in significantly higher call prices.
I just found this channel and I am impressed on the high level of information. Do you have any recommendations for looking up historical options data? Thank you!
Hi, Orhan! Thanks for the positive comments! Much appreciated. I'm glad you've gotten value out of the videos. In terms of historical option data, a source like CBOE would be the best (datashop.cboe.com/). However, the data is quite expensive so a cheaper alternative would be Historical Option Data (historicaloptiondata.com). I hope this helps! -Chris
Siddhesh, Thank you for the kind comment. I am not a guru by any means. What you're seeing is just what I've learned after many years of exploring and learning the options trading space. I'm not aware of any formal education. The way I've always learned is through experience and spending time looking for answers to questions I have when I come across a new topic/concept.
Hi Chris, I would like to ask a question: 1) Is Volatility Skew applies to all product as in stock option. Such as AAPL / FB etc, or only applies in VIX 2) How do I know that which product was on upside or downside of volatility Skew? Is it base on the pricing on the day that we intent long / short? What if today it is on downside skew and next week was on upside skew? 3) About Implied Volatility, is it that all the products in the market when price rises IV Falls and price drop IV Rise?
Brandon, 1) Any products with options will typically have skew to the upside or downside (meaning a skew exists). 2) You can check volatility skew by analyzing out-of-the-money option prices that are equidistant from the stock price. For instance, if you're looking at a $150 stock, check the 140 put and 160 call (both $10 out-of-the-money) and compare their prices. The more expensive option will reveal the side of the volatility skew. For example, if the 140 put is $2.00 and the 160 call is $0.50 then the volatility skew is to the downside. Volatility skew will rarely switch sides in a short period of time. On most equities volatility skew will be to the downside because most people own stocks and therefore that's where the risk is. On volatility products such as VIX options, VXX, or UVXY, the skew is to the upside because the products can potentially surge higher when the market falls. 3) Equities typically observe increasing option prices when the stock price falls (because uncertainty regarding the stock's future valuation increases) and decreasing option prices when the stock price increases. However, there are times when you'll see a stock's option prices decrease when the stock price falls (which could occur if the stock price falls slightly after an earnings report) and other times when the options will increase when the stock price rises substantially. I hope this helps! Let me know if you have follow-up questions. -Chris
Hi Chris, Thanks for the great respond. I am a little confuse here, as you mention most equities skew was to be downside and found it quite true especially for equities Stock. 1) So most equities stock was on downside, now we know the premium is much more expensive, do you mean that we should goes in bearish strategy for case like this since that is the area which perceived risk. 2) Another thing which I figure out for few of the stocks option chain when the skew is heading down, let's put the example as below Option Chain Underlying at 50 OTM Put width was 49, 48, 47 (reduction by 1 point) OTM Call width was 50,55, 60 (Width by 5 points) What does this really mean?
$NOK puts had IV of around 25%. Calls had around 35%. That means the IV is skewed up, right? So that means the expectation is for it to go up. So since it is expecting it to go up you will make less if it actually goes up while owning calls vs if it goes down while owning puts, right?
It's very difficult to accurately gauge skew in NOK because the only options with any premium are right at-the-money. The options a few strikes away from the stock price have a $0 bid and a $0.01-$0.02 ask. As a result, it's very difficult to gauge skew in this stock. -Chris
This guy must get paid each time he says "so" or "now". You really need to get rid of these nervous tics if you are trying to build a social media platform. I guarantee it is driving viewers to other YT channels


Ultra-Competitive Commissions. Close Trades for Free.* $10 Commission-Cap Per Option Leg.**
www.projectoption.com/tastyworks/
Your videos are absolutely perfect !! Simple, informative, plenty of examples. I learned more from you than from my MBA.
This is one of the most useful explanations of skew and its practical application that I've come across, even from paid courses. Thanks!
Hi Chris. It would be very helpful to hear from you about Max Pain Option Theory
Great video! I’m still trying to grasp the concept of price on spreads relative to volatility skew. This video will be on repeat lol. Thank you again for all that you do.
Great video!
One thing to clarify here though:
The spreads you refer to in the video all seem to be debit spreads where you buy the closer to the money option and sell the farther out of the money option, hence resulting in cheaper spread because farther option is more expensive due to higher IV -> resulting in a cheaper spread indicating the direction of volatility skew.
If you wanted to sell the spreads, basically do credit spreads, the reverse would be what you should be looking for, right?
You are selling the near option, buying the farther out strike option. In this case credit spreads would be cheaper in the direction of the volatility.
12:50 Ok, Puts are in higher demand on downside volatility skew making them more expensive. When a spread is in place, the spread is more expensive on the call side, does this mean it's better value to purchase the PUTS? and how can this be true if puts are in higher demand, making them more expensive? Great video btw but pls lmk
I run into this a lot and knew there was a reason. Thanks a million...very helpful.
You're welcome and thanks for the comment!
-Chris
great vid, nicely covered, but here's the rub: in the downside (reverse) skew example w/ 2310 put @ 10% vol vs 2260 put @ 11.7% vol - 10 vol, although lower in absolute terms than 11.7 can be expensive in relative value terms, as well as 2310 call @ 8.5% vol can be relatively cheaper vs 2360 call @ 7.7% vol. Because just like a $100 stock > $25 stock, the $100 stock can be in a lower %ile range of its relevant lookback period while $25 stock can be @ the higher %ile end. So too, vol surface (skew + term structure) is same - vol is relative to itself as well as other points on the surface as each delta & tenor need to compare its current IV vs historical IV
ie., 10% vol can be in 90th percentile for that particular delta/tenor while 11.7% can be in the 10th percentile for its own particular delta/tenor
The example at approx. 3:00 fails to take into account that the SPY was scheduled to go ex-dividend on March 17, which just happens to be 35 DTE from the Feb 9th date in the example. All else equal, a put and call at same strike will differ in price by the expected dividend plus/minus the strike vs. underlying price delta. This more than explains the $24 vs. $29 prices.
If I may ask a few questions please -
1) You said VIX is IV on 30 days SPX options. that's what I read on google. But in increasing market - Volatility would increase ( not based on direction - just a measure of SD guage ) so I would assume IV on 30 day SPX options would increase too ? but as we know VIX generally tanks. What am I missing ?
2) of all the different IV's ( across the strike chain and across day to expiration ) - how is the stock IV calculated using these numbers ? I always heard people mention it is calculated using option IV but never really found ( I admit I have not looked thoroughly ) the calculation using all these IV's . If you could kindly give a url or something ?
3) IV and option price seem like the chicken and egg problem. Don't option prices require IV ? How do brokers get the option prices so readily - there has to be an automated way for them to get IV to feed for option prices across the chain. Why don't we use that method to gauge IV rather back calculate using option price ?
Sorry if a little lengthy but would appreciate your kind attention a ton and more! thanks!
1) What do you mean by volatility is always increasing in a rising market? In terms of implied volatility (option prices), we typically see falling implied volatility as markets are rising, as there's more complacency and very little fear in a rising market. The VIX could increase with market increases (especially with a strong breakout to new highs), but is much less common to observe.
Also, keep in mind that implied volatility is just a number that quantifies option prices (said simply). When traders bid up option prices (to speculate or hedge), the increase in the option prices causes an increase in implied volatility (all else equal).
2) The overall implied volatility you see in each respective option chain takes into account the prices/implied volatility of the options in that expiration cycle. I don't have the exact calculation (it's likely complicated) and may vary by broker.
3) IV and option prices always create interesting discussions. However, IV changes as a result of supply/demand for options. If everyone in the market rushed to buy every option in site, we'd see a large-scale increase in option prices and also implied volatility. However, you could make the argument that IV also "drives" option prices, as really low or really high levels of implied volatility could cause traders to buy/sell options based on an assumption that the IV would revert from its current level. Brokers have live data feeds for their option price quotes, and then from there, the broker calculates Greeks/IV themselves (to my knowledge).
I hope this helps!
thanks so much for the reply! regarding 1) I meant that Volatility is merely Standard deviation which is not affected by the direction of the price move rather the abs. move itself. So, if the market is rising pretty fast the SD hence volatility should be higher by conventional definition ? We both agree VIX decreases in this scenario. question is does SD increase in rising markets hence does Volatility increase? Sorry, if I am out of logic here - I am kind of new but I really think there is a break in volatility and IV in case of rising markets where volatility/SD increases but IV decreases irrespectively.
Good explanation, loved it. Thanks.
Quite obvious you know a great deal about options, please keep the videos coming... I'm learning a lot. Thanks!
Will do! Thanks for the comment!
Very solid explanation. Congrats.
Thank you for the comment! I'm glad you found the video helpful.
-Chris
Hi Chris, quick question; if for down skewed security if the vol skew widens would that mean market is likely to go up and if spread contracts it's more likely to go down?
Hi Ankit!
Could you rephrase your question, please? I am not quite sure what you are asking.
The volatility skew itself does not tell us which direction the market is likely to go. There isn't anything we can look at to determine the more likely direction of a stock's movement.
Volatility skew tells us where the market is pricing in the most risk/likelihood of a bigger movement.
In a product like VXX or UVXY, significant short-term increases are more likely than significant short-term increases, since the VIX Index/futures typically experience short-term explosions to the upside when the market falls.
In a product like the S&P 500, the market typically heads higher in a slow manner and falls violently (as we've seen recently), which is why the S&P 500 has downside volatility skew (puts are more expensive/trade at higher implied volatilities than calls at equal distances from the current market price).
But just because there is downside volatility skew, it doesn't mean the market is more likely to decrease than increase. All downside volatility skew tells us is that a larger movement to the downside is more likely than the same magnitude of movement to the upside (for example, a one-day decrease of 3% is more likely than a one-day increase of 3%, at least based on historical market movement statistics).
I hope this helps/makes sense!
-Chris
Thanks Chris. So what I mean is say the typical downward skew of an index is 1.2 ( considering OTM options). This means that put vol is 20% higher than call. Now say this ratio changes to 1.5 or 1, does that mean anything? My gut is that it tells you where the stronger hands in market are inclined towards. But happy to be corrected.
Great video. Thanks for making it. I'm reading "The Option Trader's Hedge Fund" right now. That book discusses the importance of IV skew and using it as an edge. Your video helped put a visual to it. I've been trading options frequently for over a year now. My success rate is so much better now compared to when I was trading stocks alone. IV is a key edge. Thanks again.
Thanks for the comment and you're welcome!
jgfunk hey friend can you please suggest how to potentially use IV skew on trading? It's our specific to a certain strategy or is there a generic best practice?
best video of all I saw
Does the skew predict the price direction? So, if IV in puts is higher than in calls, would that mean that market participants expect the underlying to go higher or lower? I always thought when IV is higher in puts, people anticipate a move down in the underlying. Is that correct?
Hi Sergei,
It doesn't necessarily predict the future price direction, but it does tell us where the market is pricing in the greatest risk. For stocks, especially stock market index products like the S&P 500, the primary risk is to the downside because the most common investment position is to own shares of stock.
But just because the risk is priced into one direction, it does not mean that the underlying WILL move in that direction, it's just where the largest risk lies for those exposed to those products.
Instead of "risk," we can also think of it as the greater likelihood of a BIG move. In the stock market, it's typically more likely to see the S&P 500 down 5% in one day than up 5% in one day. As they say, "the market takes the stairs up and the elevator shaft down." The expensive put prices relative to call prices reflect that belief (downside skew).
In volatility products like the VIX Index or VXXB, it's much more likely to see these products increase by 50% in one day as opposed to decreasing 50% in one day, which explains why the puts are cheaper than the calls on these products (upside skew).
I hope this helps! Let me know if you have any follow-up questions.
-Chris
Greetings from Brazil. First of all, amazing videos Chris! Great explanations. I used to work as a derivatives broker in a local bank, and I have some doubts. Almost all of the equities in the Brazilian market have a very skewed shape in its volatility chart. In addition, most of the stock's options have low liquidity and sometimes they don't even have enough volume in a daily basis to keep an updated option chain. In this case, what are the main approaches to estimate implied vol and skew when you got no data? Is there any modeling that could generate a reliable volatility surface? And have you ever seen someone gauging the skew with open interest and volume data? HV is generally very off and the market tends to add a very high premium due to illiquidity and the shapes sometimes are not "smooth".
Hi Raphael,
Thanks for the comment!
To get accurate skew data, we need accurate option price data. Without any trading volume in the options, there's no way to no the "fair" price for that option based on all the activity from market participants.
With that said, without liquid options, any skew information is not that valuable (garbage in, garbage out type of situation).
Do the stocks you're looking at mostly have downside volatility skew? If so, that's normal since the general population's risk is to the downside because they own shares of stock, and buying puts is one way to reduce that risk.
It's impossible to get skew from volume/OI because those figures tell us nothing about the prices of the options we're looking at. To get accurate skew information, we need option prices.
I hope this helps!
-Chris
@@projectfinance Tks for the reply, Chris. What intrigues me is how market makers price an illiquid option. Since there are no prices on the screen for these options, what usually happens is that the buy side calls a market maker and he gives him a spread.
Maybe the mm just get an average HV from the main index and add huge spreads to compose the bid/ask prices. Or get the HV from different markets and from a basket of companies in the same sector. Nevertheless, it's a very poor proxy and it does not rid them to at least estimate the shape of the skewness of the stock in question (you still need an average price to add the spread).
With that said, maybe a similar scenario in the US market would be for long expiration options, that has significantly lower liquidity than the short ones, even though sometimes you can see some trades occurring.
Fantastic video!
Can options data also be used to predict daily FX pair moments and indices such as FTSE and DAX?
Hi Chris, I have a few questions:
1. Is there a way to measure Volatility Skew of an underlying? Is there a way to see that in TOS?
2. When you see SPX for example getting more or less skewed, how does that affect your placing trades based on your 3rd observation? Sell more Call Spreads when it skews to the downside more?
Thanks!
Hi Herman,
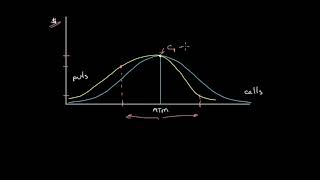
Yes, advanced options traders typically look at the "volatility smile" or "volatility smirk" of a stock's options, which is essentially the IV of each strike price plotted onto a chart, which usually looks like the shape of a smile/smirk: www.investopedia.com/terms/v/volatilitysmile.asp
I believe there's a way to see the chart on TOS at the bottom of the trade page, but I'm not sure how as I don't use the platform anymore.
I don't actively track skew as I follow a pretty simple options-selling strategy on SPX and don't enter/exit trades based on volatility skew. However, I think it's worth understanding what volatility skew is and why it exists, which is why I made this video.
Best regards,
Chris
@@projectfinance thank you for your answer.
Quick question; did/do you employ a top down strategy on the underlying stock when screening?
Hi Marty, I'm not sure what you mean by top down strategy.
@@projectfinance Top down would be looking at a potential trade from three perspectives: 1. what is/are general market conditions - bullish or bearish
2. what is the condition of sector that the underlying security - bullish or bearish
3. what is the condition of the underlying security - bullish or bearish
Got it. Personally, I don't use any screening because I trade the same two underlyings/strategies and don't need to do any scanning for additional stocks.
I'm curious what you'd say about $NOK stock. They basically barely move unless it is right after earnings.
Justin,
I personally wouldn't trade the stock since it is only $6 and there's not much you can do with the options in there (only premium is at-the-money).
The good thing about options trading is that you have complete control over what you trade.
In my case, I only trade a small handful of stocks/products these days.
-Chris
Great video- very glad to have found your channel! Thanks!
Konika,
Thank you for the comment! I'm glad you're enjoying the videos.
-Chris
Something is missing!! Risk to downside=more puts in demand=expensive puts but the video states in the end #3 call spread & put spread section___expensive put spread at upside volatility. What am i missing and i am talking only in terms of market to volatality relation. Anyone please clear this
Hi Divyajeet!
The difference is the products that were being analyzed in each section.
Equity index products such as the SPX Index (S&P 500 Index) have downside volatility skew (puts more expensive than calls at similar distances from the stock price) because all of the risk lies with market declines. Most people own stocks, so they are prone to losses when the stock falls. Therefore, put purchases are natural and drive up put prices more than calls.
Regarding volatility products like VXX, the value of VXX will surge if the stock market falls, which means VXX has big risk to the upside. Therefore, call purchases are natural as hedges and the calls get more expensive than puts at similar distances from the stock price.
So, the volatility skew or risk is not always to the downside like it is for equity index products. Sometimes, if a product's movement potential is greater to the upside, the calls will be more expensive than puts at similar distances from the stock price (upside volatility skew).
I hope this helps.
-Chris
Great explanation. Thank you. Will have to watch it again
Thanks! I appreciate it
Great video. One question: on equities bull call spreads are more expensive than bear put spreads. Now are bear call spreads less expensive than bull put spreads? Because now you’d be shorting the higher vol options.
It doesn't matter whether you're buying or selling a spread, the price applies to both buying and selling the spread.
If the call spread you're analyzing is trading at a higher price than the put spread you're analyzing, you'll pay (collect) more for buying (selling) the call spread compared to buying/selling the put spread.
projectoption thank you for your response. This means that I’ll collect more premium by taking a bull put spread than a bear call spread if I read this right?
Great vid on Volatility Skew so far
Thank you, Imran!
Well explained .
Thank you!
three things at 7:36
While this is very useful info, I wonder how to use it for trading. So on the call and put spread example I will trade one of them based on my directional view and not because one is cheaper over other right?
Hi Ankit,
You're correct. This video was more on the educational side and not necessarily suggesting one trade is better than the other.
When trading options, the position you trade should always reflect your outlook on the stock's future price movements (or lack of movement).
-Chris
projectoption agreed.
wtf?? only 25 views... thats why most ppl lose money
We'll take that as a compliment.
Thanks, Tiberio!
this is dope! bestest ever! thanks much!
Thank you, Nikhil!
Very glad you enjoyed it.
-Chris
Today, the $SPX is trading at 2782, the VIX is at 12.12 the SPX option Skew is north of 142....is this pricing in, or indicating growing FEAR of a sharp market correction.....I would have thought, if the market was not fearful of such, the SKEW would be below 120......welcome comments from an OPTION pro...thanks...Don
First comment, please correct me if I'm wrong: the different option prices for different strikes don't imply anything to do with volatility skew (as you state at the start): even if each option had the SAME % IV, they would have different prices. Please re-listen to the start of your video, as it's wrong.
Vey cool! how do you get the skew plots in TDAMERITRADE?
Thanks!
To see volatility per strike in thinkorswim, head to the trade page of the product you want to see skew for. Then, scroll to the bottom and click on the "Product Depth" tab.
From there, select the expiration cycle you want to see skew for and you'll be able to see the IV per strike for calls and puts.
Also not true on perceived risk discussion: with "everyone" long stocks, as you know, they use puts to hedge. If they/money managers used options primarily as the form to go long, then we could compare that way
You don't have to use options to hedge options. You can use options to hedge stocks. It doesn't matter if they are long via stocks or calls. Puts can be used to hedge both. Although everyone being long via calls would result in significantly higher call prices.
I just found this channel and I am impressed on the high level of information. Do you have any recommendations for looking up historical options data? Thank you!
Hi, Orhan!
Thanks for the positive comments! Much appreciated. I'm glad you've gotten value out of the videos.
In terms of historical option data, a source like CBOE would be the best (datashop.cboe.com/).
However, the data is quite expensive so a cheaper alternative would be Historical Option Data (historicaloptiondata.com).
I hope this helps!
-Chris
projectoption thank you for the links Chris! looking forward to use your service later this year
You're welcome! Anytime!
-Chris
You are Volatility Guru any formal education one has to take to learn all these things?
Siddhesh,
Thank you for the kind comment. I am not a guru by any means. What you're seeing is just what I've learned after many years of exploring and learning the options trading space.
I'm not aware of any formal education. The way I've always learned is through experience and spending time looking for answers to questions I have when I come across a new topic/concept.
Hi Chris, I would like to ask a question:
1) Is Volatility Skew applies to all product as in stock option. Such as AAPL / FB etc, or only applies in VIX
2) How do I know that which product was on upside or downside of volatility Skew? Is it base on the pricing on the day that we intent long / short? What if today it is on downside skew and next week was on upside skew?
3) About Implied Volatility, is it that all the products in the market when price rises IV Falls and price drop IV Rise?
Brandon,
1) Any products with options will typically have skew to the upside or downside (meaning a skew exists).
2) You can check volatility skew by analyzing out-of-the-money option prices that are equidistant from the stock price. For instance, if you're looking at a $150 stock, check the 140 put and 160 call (both $10 out-of-the-money) and compare their prices. The more expensive option will reveal the side of the volatility skew. For example, if the 140 put is $2.00 and the 160 call is $0.50 then the volatility skew is to the downside. Volatility skew will rarely switch sides in a short period of time. On most equities volatility skew will be to the downside because most people own stocks and therefore that's where the risk is. On volatility products such as VIX options, VXX, or UVXY, the skew is to the upside because the products can potentially surge higher when the market falls.
3) Equities typically observe increasing option prices when the stock price falls (because uncertainty regarding the stock's future valuation increases) and decreasing option prices when the stock price increases. However, there are times when you'll see a stock's option prices decrease when the stock price falls (which could occur if the stock price falls slightly after an earnings report) and other times when the options will increase when the stock price rises substantially.
I hope this helps! Let me know if you have follow-up questions.
-Chris
Hi Chris, Thanks for the great respond.
I am a little confuse here, as you mention most equities skew was to be downside and found it quite true especially for equities Stock.
1) So most equities stock was on downside, now we know the premium is much more expensive, do you mean that we should goes in bearish strategy for case like this since that is the area which perceived risk.
2) Another thing which I figure out for few of the stocks option chain when the skew is heading down, let's put the example as below
Option Chain
Underlying at 50
OTM Put width was 49, 48, 47 (reduction by 1 point)
OTM Call width was 50,55, 60 (Width by 5 points)
What does this really mean?
$NOK puts had IV of around 25%. Calls had around 35%. That means the IV is skewed up, right? So that means the expectation is for it to go up. So since it is expecting it to go up you will make less if it actually goes up while owning calls vs if it goes down while owning puts, right?
It's very difficult to accurately gauge skew in NOK because the only options with any premium are right at-the-money.
The options a few strikes away from the stock price have a $0 bid and a $0.01-$0.02 ask. As a result, it's very difficult to gauge skew in this stock.
-Chris
..
This guy must get paid each time he says "so" or "now". You really need to get rid of these nervous tics if you are trying to build a social media platform. I guarantee it is driving viewers to other YT channels
I did used to say those words a lot. I am better about it in newer videos.