How the Discrete Fourier Transform (DFT) works - an overview

Вставка
- Опубліковано 15 вер 2024
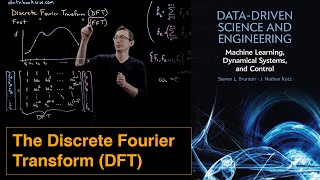
- Notes at pzdsp.com/docs. A concise overview showing how the DFT determines the frequency content of a signal.
A more detail explanation is available at • Discrete Fourier Trans...


Dang, I've watched about a dozen videos trying to get a good intuition for what is happening in the transform with no luck. But you just laid it out so clearly and in only like 4 minutes. Bravo.
You deserve a lot of credit for this quick but insightful video on the FT. So often explanation videos on youtube are mathematically tautological, but here you went blind the mathematical scene to explain the logic behind the equation
Thanks. I appreciate that comment a lot.
Dude thank you very very very much. Realize that you saved 40k people (including me) from absolute horror. I tried: giong to college, reading the book, making excercises and exam questions, but none where able to explain it corretly, or even the basic.
Also thumbs up for your visualized way of explanation it works really well. You are also able to explain it, very clearly, while using engineering jargon. This amazes me, because I usely get terms thrown at me untill the explanation enters an imaginary black magic dimension which is comlpetely alien to me.
(tl;dr I wish more people would be able to explain things clearly in the academic field) Off-topic, but a tip I want to tell: sometimes people use excessive amounts of jargon in scientific literature and somtimes compiled books made by the teacher. Exmaple: I had to make reports about very small geological areas and how they developed in the past 700 million years. I realised that some reports used such an extensive amount of jargon that they became multi-interpertabel for laymen (like me). Which requries you to go on google and seek for explanations, which doens't always work, because some terms are used by such a small amount of scientists that the meaning becomes untracable on the web. The core problem is that teachers or scientists write the literature for a specific audience. In order to prevent excessive details for a specific part of their audience, they don't mention it at all, causing laymen (some people think of them as stupid) to not understand the literature at all.
yep i fully agree. i was confused on all the different terms and have been trying to learn FFT when i should have been learning DFT.
everyone just gives the basic explanation of how any wave can be made up of infinite sines, then just jumps at warp ten into mr spock level maths.
man im subscribing to this channel so freaking hard. i fact, im unsubscribing - just so i can subscribe again!
U6
I remember discovering that if I thought of mathematical processes and algorithms as really nothing more than abstract machines, their behavior was much easier to understand. This is a really great example of that.
this is one of the most well explained argument about signalss!! THANK YOU SO MUCHHH!
This was really simple, i don't know why they don't explain it like this haha. good job!
Better than 3 hour lectures no cap
brilliant tutorial and the best I've seen.
Great explanation.
An interesting thing to notice is that in methods like PCA ( Principal component Analysis) , there is no pre-existing basis function.
It depends on the input itself ( obtained by SVD of input matrix )
Well done ! Short and to the point.
DFT perfectly explained !!
Thanks a ton Sir.
Thank you sir ! It is very helpful for every student who is really curious who wants to know the DFT !
Perfectly explained. A big thumbs up to you.
professional explanation - very clear
Excellent! How one can explain the Nyquist (or negative frequencies) by this approach, please?
I'm not sure there is a good way to explain the concept of negative frequencies by this approach. Here's a link to a video on negative frequencies that might help. ua-cam.com/video/Rxc_ypVdruw/v-deo.html
i love the way you explain
you are a god, thank you
Thank you, David
Awesome explaination!
This guy is a legend.
why should the analysis basis function always be sinusoidal? why not rectangular or triangular or any other shape?
Other transforms do use different basis functions - wavelet transforms for example. There are some requirements for basis functions to ensure that you can recover the original signal using an inverse transform though - www.math.tamu.edu/~larson/wutam.pdf might be of help
Your videos are great! I would like to ask you how we can use fft function in matlab for a space-based data in order to find its wavelengths, I mean using DFT for finding wavelegths present in a space-based data. this data can represent the roughness of a surface in distance. Do you think it is possible to use fft for this purpose or we have to code it ourselves?
Niloofar It doesn't really matter where the data comes from so I don't see why not
At 2:11 you're right. A complex number is a number that has both real and imaginary parts. An imaginary number is a number that is only imaginary with no real parts. A real number is a number that is real with no imaginary parts.
very nice , i always love ur video
hye david. what is the diff. between fft and dft func? kindda look the same to me the output result for both of the func. can you explain? thnks!
the FFT is just an efficient implementation of the DFT. The output of both is the same. However the fft requires that the signal being analysed be of length N = 2^m samples where m is a non zero positive integer.
+David Dorran Wow! That is exactly what i needed. Thank you so much!
keep up your good work...briliant
the explaination is a bit misleading. What you are talking about is Fourier Series and fourier coefficients, not the DFT.
Fourier series is used to express a periodic signal trough its the frequency components, and since the signal is periodic, it has to be time-unlimited, and also his spectrum will be discrete (eventually also band-unilimited when the time signal has discontinuities, such a square wave signal, since we can only approximate trough the infinite sum of continuous sinusoidal functions). The signal you are analysing is continuous, so you are just calculating his fourier coefficient via the correlation integral. Also, this holds assuming that your signal is periodic (and you perhaps forgot to tell that) and hence the graph you are showing is just a period of the whole signal. If it isn't the case, then the signal would be non-periodic, and hence you would need to use the FT which gives a continuous spectrum, not a discrete one.
DFT instead works on discrete signals (sequences), which is not the case that you are depicting here. Since they are they are discrete, their spectrum must be periodic. Also since their spectrum will be discrete (sampled), the time signal also will be periodic. So both the sequence and the spectrum are necessarily discrete and periodic in DFT.
Also the notation x[n] is usually used for time-discrete signal, you should be using x(t) for time-continuous signal instead.
It's a discrete signal in the plot. The samples are just really close together. I realise a lot of text books show discrete signals with a line drawn from the sample point but it didn't look good for this video. Check out ua-cam.com/video/B2iUDBZzBpY/v-deo.html for a detailed video on the DFT.
@@ddorran I see now. Looking at the video again, you also talk about the number of cycles over the N samples of the signal, so it actually does imply that the signal is discrete. It's a bit subtle tho, i still think that what you are depicting with the graph does not represents easily the things you explain with your voice, and people could get confused when expecting to see a discrete signal. I left that comment hoping that it could be helpful for other people that might be confused by the signal plot.
Unfortunately I don't have time to check the detailed video, but i hope it will be helpful for other people, since those concepts are very important in a lot of modern applications and jobs.
great stuff !
Cheers !
beautiful
very nice
Of course, this is only 1D DFT.
SUPER!!!
ehhhh, dopytka PPS PWR :(
First