Thanks for another useful tip, one quick question. When you use calculation group, how do you setup conditional formatting? In your example, how to apply red or green on % change calculation item column?
Good one and trying to figure out how to use the calculation gorup. I think for % of Total Sales measure in the calucation part for the switch satement it needs to be the measure ie [Total Sales] and not the text "Total Sales" ?
Hey! Very interesting trick! Actually I'm suffering with measures and calculated coloms if you can help me to solve it please, I have created a measure for sales amount 2020 (S.A 2020)and a measure sales amount 2021(S.A 2021) then divided (2020 VS 2021)them in percentage to have a measure for customers that you are loosing ( less than 50% of sales amount than last year). Every thing was running correctly except when I decided to sort my clients with the If function : if(2020 vs 2021 >=1,1,if(2020 vs 2021>=0.5,2,3). It worked in measures, I have 1 if the result is 100% or plus, 2 if it's between 50% and 100% and 3 if it's less than 50%. But I can not slice with the measure, I need to have the same results (1,2 and 3)in a calculated colomn that I could use to filter my report.. Thanks in advance for the help.
One question: I use multiple count measures in matrix under values box, and drill through from one measure value to detail page. There im getting different row count. Why this happens ? Please help
Hi Chandeep! In your example, what if you have a category slicer and also have the field in column instead of row. Let’s say we only need Value under each selected category. How can you calculate the difference, for example, between first two selected categories, say accessories and bikes? Is this doable?
Hello, Can we apply or display the LY % change as just the icon using field formatting?? like it should display either increase or decrease in the percentage value.
Thank you, Thank You, Thank You, exactly what i am looking for, you made my day !. How can i calclulate YTD Value if i make same calculation by Month. I did Value & % (Revenue) by month JAN-DEC, i would like to get end of of JAN YTD Values, could you please help?
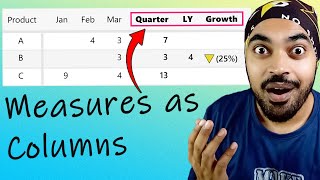
In my matrix table has 4 quarters and I created measure for YTD. When I dragged it into matrix table that YTD showing in every quarter but we need YTD in separate column in my table. how can we do that can you please help me on that.
Hi Chandeep, I have a matrix with two values which is the Planned Output and Actual Output... my columns is weekly so what happens is every week i have 2 columns for Planned and Actual... is there a way where I only want the Planned Output to appear only once since it does not change every week?
excellent but tabular editor is little bit tricky, could you please explain how to create a group in tabular editor, what you created a measures in this video just difficult to understand can u explain it....


Thanks for another useful tip, one quick question. When you use calculation group, how do you setup conditional formatting? In your example, how to apply red or green on % change calculation item column?
Without tabular editor, is this possible. Knowledge provided is superb. I recently. Listened some videos
Not yet.. hopefully Microsoft will soon release this feature natively in PBI.
Hello, amazing trick for us accountants creating P&L in PowerBI. Thank you.
Very good video and useful video. Thanks chandeep for sharing your knowledge with us.
Excellent Chandeep! Thanks for the tips on using a Calculation Group. Very useful! Thumbs up!!
This rocked man thank you so much!
glad you like it!
Your videos are always fascinating, nice video and explanation
Good one and trying to figure out how to use the calculation gorup. I think for % of Total Sales measure in the calucation part for the switch satement it needs to be the measure ie [Total Sales] and not the text "Total Sales" ?
Hey! Very interesting trick!
Actually I'm suffering with measures and calculated coloms if you can help me to solve it please,
I have created a measure for sales amount 2020 (S.A 2020)and a measure sales amount 2021(S.A 2021) then divided (2020 VS 2021)them in percentage to have a measure for customers that you are loosing ( less than 50% of sales amount than last year). Every thing was running correctly except when I decided to sort my clients with the If function : if(2020 vs 2021 >=1,1,if(2020 vs 2021>=0.5,2,3).
It worked in measures, I have 1 if the result is 100% or plus, 2 if it's between 50% and 100% and 3 if it's less than 50%. But I can not slice with the measure, I need to have the same results (1,2 and 3)in a calculated colomn that I could use to filter my report..
Thanks in advance for the help.
Thank you for the tips! Appreciate if you could share on how to do conditional formatting on calculation group
Any solution you found for the conditional formatting Calc groups?
One question:
I use multiple count measures in matrix under values box, and drill through from one measure value to detail page.
There im getting different row count.
Why this happens ?
Please help
Very well explained... Thank you Chandeep!!
Hi Chandeep! In your example, what if you have a category slicer and also have the field in column instead of row. Let’s say we only need Value under each selected category. How can you calculate the difference, for example, between first two selected categories, say accessories and bikes? Is this doable?
Good trick, thanks mate!
Thanks for Video, it is very useful...😊😊😊😊
Thanks for Guiding us
You saved my day!!! Thanks a lot.
Glad it helped!
Hello, Can we apply or display the LY % change as just the icon using field formatting?? like it should display either increase or decrease in the percentage value.
Thank you, Thank You, Thank You, exactly what i am looking for, you made my day !. How can i calclulate YTD Value if i make same calculation by Month. I did Value & % (Revenue) by month JAN-DEC, i would like to get end of of JAN YTD Values, could you please help?
In my matrix table has 4 quarters and I created measure for YTD. When I dragged it into matrix table that YTD showing in every quarter but we need YTD in separate column in my table. how can we do that can you please help me on that.
Hi Chandeep, I have a matrix with two values which is the Planned Output and Actual Output... my columns is weekly so what happens is every week i have 2 columns for Planned and Actual... is there a way where I only want the Planned Output to appear only once since it does not change every week?
can we have the month also in the column to view it for comparing the monthly values?
@Chandeep, how do you change the order of the columns in a matrix?
excellent but tabular editor is little bit tricky, could you please explain how to create a group in tabular editor, what you created a measures in this video just difficult to understand can u explain it....
How did you add the highlighter on the operating profit?
Thanks a lot ,That was helping
Awesome video!
Extremely useful
Cool. Thanks!
why you dont blink?
Thanks!
no external tools is visible
where is this option in 2024 version
Thank you sir
I want to do your course. But it's kinda expensive for me..
sir.. how can i contact you for course training?
The links are in the description. You can join any of training programs.
Hope this helps
Thanks