Hello again Uzumami and thanks for the positivism! It is just a coincidence in a couple of my vids that MR appears to be zero at allocative efficiency. In a perfectly competitive firm, in fact, the firm would never produce where MR=0 because the MC would be greater than MR so the firm would not be in a profit maximizing position. Btw, I am not familiar with Edexcel. Sorry about that one. Hope this helps.
Usually on an exam, these numbers would be given and might appear on the graph. It would be unusual (but not impossible) for a question to ask you for numbers as a result or final answer.
Hi Caroline, minimum ATC ALWAYS intersects the MC. Depending upon the costing structure of the firm, the U-shaped ATC curve and it's minimum can be above, below or right at MC=MR. It is the ATC curve's position relative to the industry demand curve that is really important.
So if I graphed the minimum of ATC on MC below where MC = MR that is still correct? Also can ATC's minimum intersect MC then begin increasing to intersect q*?
Hi Rex. Interesting question. While it is true that some monopolies may face a relatively in elastic (vertical) demand curve, most monopolies will sell mor units as they lower the price. Why? Because in most situation, some customers can do without. If the monopoly lowers price and sells more, then we must have a downward-sloping demand curve.
A monopolized firm will not produce at D=MC because their profit it too low. They will get more revenue there, but its not profit maximizing. D=MC will only happen if the market is perfectly competitive. You should also explain that MR can =D. That takes place when there is price discrimination.
Very helpful. What happens if we tax the Monopolist, either the profit or a given percentage? Subsidy might reduce dead-weight loss but society might get taxed more.
Great Job, How would the whole graph look if the Monopoly had an inelastic product like for example Pharmacy B had vaccination that can cure AIDS and patented it, since the disease can be life threatening consumers are willing pay money to cure them of this disease so in a sense Pharmacy B realizes the demand for the vaccination how will this hypotheical situation look on the graph?
Great work and great graphics! Can someone tell me please...what software allows you to create animated (or even still) graphs such as these? Is there a package that specifically makes economic charts or are they created using a generic graphics package then manually created manually rather than from templates?
Hi Erica, the AVC is drawn under the ATC - always because AVC + AFC = ATC. The. AVC is a u-shaped curve like the ATC, the lowest point of the AVC intersecting the MC curve, always. Hope this helps.
;) yes.. Thank you soooo much...im preparing for exam and might need additional help. ...can I send you other questions but not necessarily abt avc curve?


thank you owen wilson very helpful
Hello again Uzumami and thanks for the positivism! It is just a coincidence in a couple of my vids that MR appears to be zero at allocative efficiency. In a perfectly competitive firm, in fact, the firm would never produce where MR=0 because the MC would be greater than MR so the firm would not be in a profit maximizing position.
Btw, I am not familiar with Edexcel. Sorry about that one.
Hope this helps.
This video is absolutely great! Thanks!
Very clear and helpful. Quick question though...does it matter if the minimum of the ATC curve is below where MC = MR?
Usually on an exam, these numbers would be given and might appear on the graph. It would be unusual (but not impossible) for a question to ask you for numbers as a result or final answer.
You sound exactly like Owen Wilson. Its mind boggling.
so owen wilson quit acting and teaching economics now, amazing!
No, he doesn't. Similar? Maybe, but no not really. And definitely not 'exactly'. Wow.
Hi Caroline, minimum ATC ALWAYS intersects the MC. Depending upon the costing structure of the firm, the U-shaped ATC curve and it's minimum can be above, below or right at MC=MR. It is the ATC curve's position relative to the industry demand curve that is really important.
So if I graphed the minimum of ATC on MC below where MC = MR that is still correct? Also can ATC's minimum intersect MC then begin increasing to intersect q*?
i thought the monopolies demand curve is vertical. what you are describing is the monopolistic competition
Hi Rex. Interesting question. While it is true that some monopolies may face a relatively in elastic (vertical) demand curve, most monopolies will sell mor units as they lower the price. Why? Because in most situation, some customers can do without. If the monopoly lowers price and sells more, then we must have a downward-sloping demand curve.
So is this monopoly breaking even or an economic profit?
THANK YOU OWEN WILSON
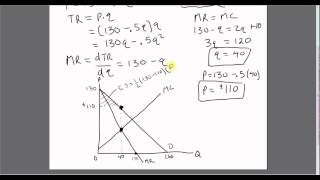
Thanks for the video. Although I still dont fully undertand why the MR curve slopes twice as much as the Demand curve.
doesn’t feel right watching an Owen Wilson video without hearing him say “wow”
A monopolized firm will not produce at D=MC because their profit it too low. They will get more revenue there, but its not profit maximizing. D=MC will only happen if the market is perfectly competitive. You should also explain that MR can =D. That takes place when there is price discrimination.
Very helpful. What happens if we tax the Monopolist, either the profit or a given percentage? Subsidy might reduce dead-weight loss but society might get taxed more.
very helpful .. which programs are you using to draw graph
my favourite subject is Economics. very easy to understand
Masooma Sayid nice subject
that is shared
hey can you please help me out since is your favorite subject.....i really need help
I understand monopoly graphs better from this 5 minute video than from a week and a half of AP Econ class.
I a'm studing the AP microeconomics, so this video very helpful
is monopolist earning supernatural profit and monopolist earning super normal the same thing or is there is a different.....please help
Great Job, How would the whole graph look if the Monopoly had an inelastic product like for example Pharmacy B had vaccination that can cure AIDS and patented it, since the disease can be life threatening consumers are willing pay money to cure them of this disease so in a sense Pharmacy B realizes the demand for the vaccination how will this hypotheical situation look on the graph?
Thnx bro
Come on! How did you draw the ATC? Change the title or do it properly!
very helpful ..sir which did you use to make graph
The best!
Love to see that my man owen wilson is branching out
very helpful. but please speak a little slow..
I'm studying for the AP Microeconomics final, so this video helped. Thank you!!!
Pourriez-vous refaire la vidéo en langue française , please
holy crap! exactly what I needed, a quick and clear review of a monopoly! THANKS!
Thanks for this..very helpful
Dear sir!
How can i draw this graphe in my computer, by which program.
Hi Muhammad, you can use either PowerPoint or Google Slides!
@@KylePurpura thank you so much
Helpful as shit, thank you
you are awesome, I did well on my test because of you
thank you!!!
wow! this was really good graphing and explanation! thanx!
Great work and great graphics! Can someone tell me please...what software allows you to create animated (or even still) graphs such as these? Is there a package that specifically makes economic charts or are they created using a generic graphics package then manually created manually rather than from templates?
please I need were i can the footnote confirms
Thank you
Damn it. I thought this was about the game
✔️
this is perfect. like i learned it in class but i needed a diagram. thanks!
You're excellent at explaining this. Thanks!
Thank you very much! Finally it makes sense
Thank you so much
Please continue making videos!
I don't get how would i put numbers on quantity and price?? >_
Honey Tirador Depending what you're being questioned on the test.
اسلوبہ سھل یقرب الی الفھم
Super very helpful!
Thank you.
very helpful
thank you
interesting
so legit!
Excellent
That was so helpful!! Thanks so much
cool!!!
yes
well
thank you!
thanks! :):)
Thank you!!
where would i draw the AVC curve?
Hi Erica, the AVC is drawn under the ATC - always because AVC + AFC = ATC. The. AVC is a u-shaped curve like the ATC, the lowest point of the AVC intersecting the MC curve, always. Hope this helps.
;) yes.. Thank you soooo much...im preparing for exam and might need additional help. ...can I send you other questions but not necessarily abt avc curve?
Sure. I will be online for another hour or so, and then back a couple of hours after that.
Great :)
you have a gift..... i'm from latin america and i get it perfectly.... thanks
Return to monke
Thank you for visually explaining the Monopoly graph.