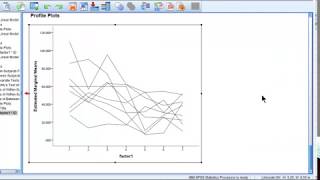
High Resolution Charts from SPSS? Yes, you can!

Вставка
- Опубліковано 6 вер 2024
- I demonstrate a solution to the problem of low-quality images (low DPI) in publications from charts/figures produced in SPSS. Journals often want 300 DPI or 600 DPI. SPSS can produce such high resolution charts, but you have to send them to the journal as a .eps or .pdf files. It's easy.


Thaks!!! I have used your recommendations two times this year for different journals!!!
Thank you so much, I was having issues with blurry graphs and this did the trick!
Thank you so much but how to combine more than one graph as one figure with the same high resolution?
thank you, it saved me a lot of time. and it's much easier to edit the colors and lines in an editing software :D
Thanks for this video. Could you please tell me how you added the legends to your graphs?
Thank you for this great video, I was wondering if you cold help with creating these kinds of plots with confidence intervals included in the graph. Thank you.
Or just use any of the free image snipping tools. Even Windows 10’s built in “snipping tool” or “print screen” functionality should provide a higher resolution image than the SPSS copy function (depending on your screen resolution)
The Windows snipping tool produces about the same quality image as the copy function in SPSS. Journals don't want these jpeg snipped images, in my experience.
Do you have any video showing how to edit your graphs that way?
How to make this type pf chart in spss
It was perfect; thanks for sharing this video.
Thank you for this great video. I'm now looking for this as requested by the Journal to improve the resolution of my images, as I copied from SPSS. But my problem is when I am exporting it following what you demonstrated in the video, the eps file will not appear in the folder that supposed to be exported to could you have any solution for this or if more steps is needed?
Thank you somuch. You just saved my manuscript.
Thanks for the video! I have a question, though. What if you are using both colours and symbols to distinguish between lines in a line chart. How can you make the legend show both the colour and symbol, combined, for each line? Haven't been able to do it :( Thanks!
Thank you
is the spss must connected with photoshop to run?
Thanks you!
thank u for this explanation, but I try these steps and donot work ......what can i do. knowing i use spsss 22
Hey, what I found works is following his tutorial but instead of .esp, save as PDF. Once saved, open and screenshot the pdf, it is crystal clear.
@@anastasias514 Yes. you are amazing! It really works when I save it as pdf
GraphPad Prism can produce journal quality graphics
Yes, agreed. R can do some good stuff, too. My impression, though, is that people criticize SPSS for a lack of graphical capabilities, which is not is not really justified, once one learns how to use SPSS to the best of its capabilities.
Great!
Lol i was too distracted by the figure.. i wish that my iq is around 75 percentile