Footprint Charts: A Futures Day Trader's Key Tool in Identifying Trends, Reversals and Support

Вставка
- Опубліковано 10 жов 2024
- Footprint charts can add a level of depth to your visuals that standard charts cannot achieve.
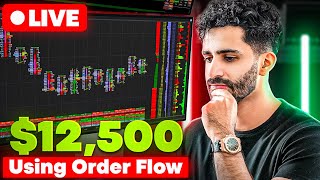
Footprint charts are a powerful way to visualize the ups and downs of the market, helping you potentially to make better trading decisions. This video shows how Footprint charts work and how they can be utilized in conjunction with traditional chart interpretations.
Optimus Future's Optimus Flow offers a clear visual display of everything you need from Footprint charts. optimusfutures...
Why is it important? Because Footprint relies on your ability to visually identify specific points, it's important that you use a modern visual display that is "easy" on your eyes-not all platforms have such displays.
________________________________________________________________________________________________
Want to learn more about Optimus Futures? Visit our website: www.optimusfutu...
Our commissions, margins, and pricing: optimusfutures....
Open an account with us today! optimusfutures....
Check out our community forum: community.opti...
Please don't forget to like the video, comment, and subscribe!
THANKS FOR WATCHING!
________________________________________________________________________________________________
There is a substantial risk of loss in futures trading. Past performance is not indicative of future results. When considering technical analysis, please remember educational charts are presented with the benefit of hindsight. Market conditions are always evolving, and technical trading theories and approaches may not always work as intended.
#FootprintCharts #MarketProfile #OptimusFlow


This was very informative. Thanks. Please do a video on all the Delta tools like cumulative, delta flow, delta rotation, etc.
Place a request here: community.optimusfutures.com/ the tech team will look at it
Why doesn't mine look like this? I am using a demo account at present so that might have something to do with it, but when I try to use the cluster chart it doesn't look like this at all
It is strongly advised that you post your inquiries on this thread: community.optimusfutures.com/c/futures-trading-platforms/optimus-flow/74 This approach will enable us to include visuals and step-by-step guidance, which will provide you with a visual reference.
@@Optimusfutures Thank you for the reply! I ended up figuring it out but will definitely refer to that link if I need help in the future
This looks very professional. I'm Signing up. I hope ninja trader doesn't buy you out too and turn your company into 💩like tradovate.
We appreciate your patronage! Currently, we operate as an independent entity.
Where do I find it on demo?
They call is Cluster Charts on the platform.
@@Optimusfutures I tried
on chart there is a magnifier symbol click on it and then it will appear or you have to enable it