at 6:30 at the bottom right there is a contour plot where its printed that (sigma_11)^2 > (sigma_22)^2 What exactly is sigma_11 in that diagram? Is it the distance from center point of the contour plot to first concentric circle? or is it distance from center to 2nd concentric circle? or is it distance from center to 3rd concentric circle? Or is it something else? Similarly what is sigma_22?
@@blasttrash When you look at the contour plot but only taking x axis, then the variance associated with distribution along x-axis is (sigma_11)^2. Similarly, for y-axis, it would be (sigma_22)^2. Look at how the 'spread' in the contour plot along x-axis is more than the same along y-axis? That is precisely what we mean by (sigma_11)^2 > (sigma_22)^2. Note that the circles are just contour plots and the distance from it to the centre doesn't necessarily mean it is sigma_11 or anything.
When covariance values in the covariance matrix (the non-diagonal values) are or tend to 1, means that the shapes of the contour will look like ellipses incline with aprox 45 degrees or follow a rect line(positive association between variables). In contrast, when the covariance values are equal to zero, means that the shape of the curves will be similir to a circle, i.e, there is no asociation between the variables (similar to figure in min 6:13).
I'd like to know how you call your x value for univariate caseü or x value set for multivariate case in your Gaussian distribuitons? Do you name them as "data set" or " variable set"? Also, what makes the mean value size same as the x data size? Thanks in advance. Should we think that we create one mean average for every added x data point in our data set? That's why we average them when we find the best estimated value in the end.
is the vector x assumed to be a row vector? I ask only because we have x - mu which is a row vector inside the exponential. To subtract components, would we not assume that x is a row vector like mu?
Could you explain more about the sum of the vectors in your notations for the maximum likelihood estimates at the minute 1.45? As far as I have noticed, there has been only one data set, namely one x vector. Thus, what actually are you summing up with j indices? Cheers.
In the formula at the minute 2.11, when you find the inverse of a Sigma matrix in the exp(...) , do you use unit matrix method, any coding , or some other method? Cheers.
At 4:32, if x and μ are row vectors, [x-μ] should also be a row vector. Then how to multiply (Σ^(-1))* [x-μ]? Since the dimension of (Σ^(-1)) is 2*2, and the dimension of [x-μ] is 1*2.
I think there is an error in the maximum likelihood formula in the order of vector multiplication. The way you have it makes the operation a dot product, not the outer product.
At 5:32, Alexander says "The scaling of the sigmas is accomplished by creating a diagonal covariance matrix". Could you explain what does "scaling of the sigmas" mean? Where are they being scaled? Thanks
When calculating the joint distribution p(x1)p(x2) for vector x_underlined = [x1 x2], he vectorizes (x1-mu2) and (x1-mu2) to the vector form (x_underlined-mu_underlined). I believe what he means by scaling of the sigmas, is a similar transformation from two seperate, scalar sigmas to a matrix, in this case the covariance matrix Sigma.
He does have mistakes and really bad inconsistencies throughout the slides. Not enough to dislike though, but enough to not be surprised of the dislikes.
At the minute of 1.34, the maximum likelihood estimates formula has 1 over N coefficient. On the other hand, at the minute of 3.13, there is 1 over m coefficients. We know that N and m is the total number of values in the sums, but what is the reason you used different notations as N and m. Is it just to seperate univariate and multivariate cases while they keep their definitions (or meaning)? Also, the j values in the lower and upper limits of sum sembols are not so clear in this notation. Should we write j=1 to j=m or N for instance?
So, when features are independent, finding P(x1) and P(x2) individually and then multiplying is same as finding using multivariate gaussian distribution 6:13 ? Is my understanding correct?
From 4:12 to 6:24 where is an explanation on the Independent Gaussian models, I have a basic doubt on the Sigma calculation. I am finding hard to understand that sigma needs to be a diagonal matrix of (sigma_1*sigma_1 , sigma_2*sigma_2), shouldnt it be a matrix of the form [[sigma_1*sigma_1, sigma_1*sigma_2], [sigma_2*sigma_1, sigma_2*sigma_2]] ? Can anyone explain that to me ?
The covariance matrix of a zero man Gaussian has entries sig_ij = E[xi xj]. So if xi and xj are independent, this is zero except along the diagonal. I think you’re describing a rank 1 matrix? Which is different from independence in probability.
One more question about the example at the minute of 4.24, you said independent x1 and x2 variables. Independendent of what??? As far as I see, you can have 2 univariate formula like in this example, but when you combine them to see the combined likelihood, you have to have a mean vector in size of 2 and Sigma matrix iin size of 2x2. That's always the case, right? The size of the mean vector and the Sigma matrix look like defined by the number of combination of x values. Is that right? I saw another example somewhere else, you can have L(μ=28 ,σ=2 | x1=32 and x2=34) for instance to find the combined likelihood at x1=32 and x2=34, and he uses only one mean and sigma for both. REF:ua-cam.com/video/Dn6b9fCIUpM/v-deo.html&ab_channel=StatQuestwithJoshStarmer
Sorry; where is that? Most likely I simply meant that, to draw a 2D Gaussian distribution requires a 3D drawing -- 2 variables x1,x2, plus the probability p(x1,x2). It's inconvenient to try to render 3D functions, so we usually plot contours in 2D instead (x1 and x2), with the contours indicating the lines of equal probability, p(x1,x2)=constant.
These slides have a number of transposition notation errors, due to my having migrated from column to row notation that year. Unfortunately UA-cam does not allow updating videos, so the errors remain. It should be clear in context, since i say “outer product” for the few non inner products.
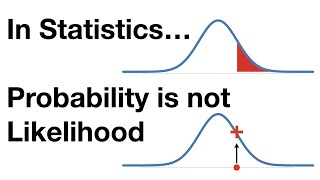
please stop using probability density and probability interchangeably. The formula for a normal distribution never gives a probability, but a probability density, which can be greater than 1.
Can you tell me the diffference between bivariate and multivariate case ? Can you also mention about when the parameters are dependent where we add extra dependence coefficient parameter? There is a sample video to refer for you give a better idea: ua-cam.com/video/Ehm0mclZs54/v-deo.html
Bivariate = 2 variables; multivariate = more than one variable. So bivariate is a special case, in which the mean is two-dimensional and the covariance is 2x2. Above 2 dimensions it is hard to visualize, so I usually just draw 2D distributions; but the mathematics is exactly the same.
@@AlexanderIhler Your initial case of 1D Gaussian with only one x value is indeed a bivariate case with one x value with two parameters,the mean and the sigma value, right? Also, bivariate case can be called the simplest case of multivariate occasion, right? If we have a data set x and a multiple variable of mean and sigmas, we have to use your MULTIVARIATE CASE with a vector of x values and mean values with a covariance matrix for the sigma values, shouldn't we? Thanks for the help in advance.
No, those are the parameters; if “x” (the random variable) is scalar, it is univariate, although the distribution may have any number of parameters. So, if x is bivariate, x=[x1,x2], the mean will have 2 entries and the covariance 4 (3 free parameters, since it is symmetric), so the distribution has 5 parameters total.
@@AlexanderIhler x is your data point, right! If it is only one scalar value, the case is called univariate case, but if it is a vector of scalar values of two, it is called bivariate by definition. That's it. For bivariate and multivariate case where the data x variable is a vector of size d, the mean is also a vector of the same size of x vector. Thus, the covariance matrix by definition the square matrix has to have d by d matrix if x and mean has d dimension as you said . I assume you said 5 parameters in total, because symmetric terms are equal in covariance matrix, so 4-1=3 parameters coming from that Sigma matrix with size d x d .


Hard to find a good explanation of this problem, until i found this! Great job Alexander!!!
Great explanation -- especially the graphical interpretation and example. Thank you!
This is great because you explain notation as well as giving solid examples!
at 6:30 at the bottom right there is a contour plot where its printed that
(sigma_11)^2 > (sigma_22)^2
What exactly is sigma_11 in that diagram? Is it the distance from center point of the contour plot to first concentric circle? or is it distance from center to 2nd concentric circle? or is it distance from center to 3rd concentric circle? Or is it something else? Similarly what is sigma_22?
@@blasttrash When you look at the contour plot but only taking x axis, then the variance associated with distribution along x-axis is (sigma_11)^2. Similarly, for y-axis, it would be (sigma_22)^2. Look at how the 'spread' in the contour plot along x-axis is more than the same along y-axis? That is precisely what we mean by (sigma_11)^2 > (sigma_22)^2.
Note that the circles are just contour plots and the distance from it to the centre doesn't necessarily mean it is sigma_11 or anything.
Finally a good explanation of the geometry interpretation of two-dimensional Gaussian! Great job!
Very helpful video with clear explanations. Thanks a lot!
Thanks for you. Alexander. The best one I have seen.
thank you very much, this is succinct and easy to understand, way better than many text books !!
I find your UA-cam videos much more helpful to learn - compared to the class videos. Maybe because I suffer from short attention span.
Thank You so much , I was struggling to understand this , you made it really simple.
The summary at the end was the best part. I would have liked some more explanation on what the different shapes of the contour plot mean.
When covariance values in the covariance matrix (the non-diagonal values) are or tend to 1, means that the shapes of the contour will look like ellipses incline with aprox 45 degrees or follow a rect line(positive association between variables). In contrast, when the covariance values are equal to zero, means that the shape of the curves will be similir to a circle, i.e, there is no asociation between the variables (similar to figure in min 6:13).
Thank you for sharing, very useful.
This is a great explanation, it helped a lot
that was extremely helpful, thanks for posting!
Nice explanation. Thank you so much.
I'd like to know how you call your x value for univariate caseü or x value set for multivariate case in your Gaussian distribuitons? Do you name them as "data set" or " variable set"? Also, what makes the mean value size same as the x data size? Thanks in advance. Should we think that we create one mean average for every added x data point in our data set? That's why we average them when we find the best estimated value in the end.
Really nice video.. Thanks a lot.. !
is the vector x assumed to be a row vector? I ask only because we have x - mu which is a row vector inside the exponential. To subtract components, would we not assume that x is a row vector like mu?
Could you explain more about the sum of the vectors in your notations for the maximum likelihood estimates at the minute 1.45? As far as I have noticed, there has been only one data set, namely one x vector. Thus, what actually are you summing up with j indices? Cheers.
thank you for this post!
In the formula at the minute 2.11, when you find the inverse of a Sigma matrix in the exp(...) , do you use unit matrix method, any coding , or some other method? Cheers.
Thank you. This was helpful!
Thank you so much , awsome work
At 4:32, if x and μ are row vectors, [x-μ] should also be a row vector. Then how to multiply (Σ^(-1))* [x-μ]? Since the dimension of (Σ^(-1)) is 2*2, and the dimension of [x-μ] is 1*2.
This is fantastic!
Thank you!
Ha, the approach of decomposing the covariance matrix would be a nice example of PCA!
At 11:02, you mean Xb=X*sqrt(EIGEN VALUE MATRIX) right?
Very nice video thank you.
clear explanation very good
should we get x vector also as a row vector with length d just like nü (mean) vector at the minute of 1.44!
Solid explanation.
I think there is an error in the maximum likelihood formula in the order of vector multiplication. The way you have it makes the operation a dot product, not the outer product.
Excellent explanation
Thanks dude! I get it now! Well almost ;)
very good tutorial
in 12:45 shouldn't the expression on top of the graph be XD rather than XC ? great video !
Love your videos! Isn't there a small mistake where you place your transpose ? Should'nt it be $\Delta^2=(x-\mu)^T\Sigma(x-\mu)$ instead ?
clearly explained!
At 5:32, Alexander says "The scaling of the sigmas is accomplished by creating a diagonal covariance matrix". Could you explain what does "scaling of the sigmas" mean? Where are they being scaled? Thanks
When calculating the joint distribution p(x1)p(x2) for vector x_underlined = [x1 x2], he vectorizes (x1-mu2) and (x1-mu2) to the vector form (x_underlined-mu_underlined). I believe what he means by scaling of the sigmas, is a similar transformation from two seperate, scalar sigmas to a matrix, in this case the covariance matrix Sigma.
Why does x is a row vector instead of column vector?
Haha, why would someone vote this down? This is great!
exactly the best I can find
They voted it down because hey are probably democrats and they don't like truth and facts
Ronny Mandal maybe bc there are some small mistakes
He does have mistakes and really bad inconsistencies throughout the slides. Not enough to dislike though, but enough to not be surprised of the dislikes.
@@chrischoir3594 I thought the republicans don't like truth and facts
At the minute of 1.34, the maximum likelihood estimates formula has 1 over N coefficient. On the other hand, at the minute of 3.13, there is 1 over m coefficients. We know that N and m is the total number of values in the sums, but what is the reason you used different notations as N and m. Is it just to seperate univariate and multivariate cases while they keep their definitions (or meaning)? Also, the j values in the lower and upper limits of sum sembols are not so clear in this notation. Should we write j=1 to j=m or N for instance?
Thanks for wonderful explanation Do you share slides?
thank you teacher :)
Thank you so much so much sooooo much
6:28 why do we create a diagonal cov. matrix. Let X be a feature set of two features (mx2), shouldn't sigma be cov(X)?
So, when features are independent, finding P(x1) and P(x2) individually and then multiplying is same as finding using multivariate gaussian distribution 6:13 ? Is my understanding correct?
yes
Thank youuuuuuuuuu♥️♥️♥️♥️♥️♥️♥️
At 11:00 isn't that the eigenvalue matrix, not the eigenvector matrix?
Thanks for the great video!
Yes, it is the singular value matrix. (square root of eigenvalue matrix)
thanks a lot
From 4:12 to 6:24 where is an explanation on the Independent Gaussian models, I have a basic doubt on the Sigma calculation. I am finding hard to understand that sigma needs to be a diagonal matrix of (sigma_1*sigma_1 , sigma_2*sigma_2), shouldnt it be a matrix of the form [[sigma_1*sigma_1, sigma_1*sigma_2], [sigma_2*sigma_1, sigma_2*sigma_2]] ? Can anyone explain that to me ?
The covariance matrix of a zero man Gaussian has entries sig_ij = E[xi xj]. So if xi and xj are independent, this is zero except along the diagonal. I think you’re describing a rank 1 matrix? Which is different from independence in probability.
AMazing thank you
awesome, thank you man!
thank you !!
thank you
One more question about the example at the minute of 4.24, you said independent x1 and x2 variables. Independendent of what??? As far as I see, you can have 2 univariate formula like in this example, but when you combine them to see the combined likelihood, you have to have a mean vector in size of 2 and Sigma matrix iin size of 2x2. That's always the case, right? The size of the mean vector and the Sigma matrix look like defined by the number of combination of x values. Is that right? I saw another example somewhere else, you can have L(μ=28 ,σ=2 | x1=32 and x2=34) for instance to find the combined likelihood at x1=32 and x2=34, and he uses only one mean and sigma for both. REF:ua-cam.com/video/Dn6b9fCIUpM/v-deo.html&ab_channel=StatQuestwithJoshStarmer
nice
Thumb up!
thanks alexa
Summary: 13:02
What is meant by compressing a 2D Gaussian function in 3D?
Sorry; where is that?
Most likely I simply meant that, to draw a 2D Gaussian distribution requires a 3D drawing -- 2 variables x1,x2, plus the probability p(x1,x2). It's inconvenient to try to render 3D functions, so we usually plot contours in 2D instead (x1 and x2), with the contours indicating the lines of equal probability, p(x1,x2)=constant.
Is it possible to compress a 2D Gaussian function?
wow
This should be mandatory viewing, before being assaulted with the symbolic derivations!
I fell asleep watching this video with both hands under my head…when I woke up both of them had fell seep asleep and wouldn't wake up in a while..
x needs to be a column vector instead of row vector.
this guy sounds like Archer.
Lanaaaaaaa!!!!!!
at 9:24 Σ= UΛU^-1 instead of Transpose
U is a unitary matrix, so they're the same
Orthogonal matrix inverse == transpose
Can anyone explain how to vectorize the formula at 5:16? Thanks
4:07 MLE for sigma-hat should be X by X-transpose (outer product) not X-transpose by X (inner product)
学习
at ua-cam.com/video/eho8xH3E6mE/v-deo.html
Why Delta^2 = (x-mu) * Σ^-1 * (x-mu)^T, not
Delta^2 = (x-mu)^T * Σ^-1 * (x-mu)?
ale beka xd
At 5.23, you should have said (x-mu) transpose.
These slides have a number of transposition notation errors, due to my having migrated from column to row notation that year. Unfortunately UA-cam does not allow updating videos, so the errors remain. It should be clear in context, since i say “outer product” for the few non inner products.
@@AlexanderIhler NO worries, we spot them.
please stop using probability density and probability interchangeably. The formula for a normal distribution never gives a probability, but a probability density, which can be greater than 1.
wow 1.5K supporter and just 40 haters :P
it is not 2 dimension, it is 3 dimension
Can you tell me the diffference between bivariate and multivariate case ? Can you also mention about when the parameters are dependent where we add extra dependence coefficient parameter? There is a sample video to refer for you give a better idea: ua-cam.com/video/Ehm0mclZs54/v-deo.html
Bivariate = 2 variables; multivariate = more than one variable. So bivariate is a special case, in which the mean is two-dimensional and the covariance is 2x2. Above 2 dimensions it is hard to visualize, so I usually just draw 2D distributions; but the mathematics is exactly the same.
@@AlexanderIhler Your initial case of 1D Gaussian with only one x value is indeed a bivariate case with one x value with two parameters,the mean and the sigma value, right? Also, bivariate case can be called the simplest case of multivariate occasion, right? If we have a data set x and a multiple variable of mean and sigmas, we have to use your MULTIVARIATE CASE with a vector of x values and mean values with a covariance matrix for the sigma values, shouldn't we?
Thanks for the help in advance.
No, those are the parameters; if “x” (the random variable) is scalar, it is univariate, although the distribution may have any number of parameters. So, if x is bivariate, x=[x1,x2], the mean will have 2 entries and the covariance 4 (3 free parameters, since it is symmetric), so the distribution has 5 parameters total.
@@AlexanderIhler x is your data point, right! If it is only one scalar value, the case is called univariate case, but if it is a vector of scalar values of two, it is called bivariate by definition. That's it. For bivariate and multivariate case where the data x variable is a vector of size d, the mean is also a vector of the same size of x vector. Thus, the covariance matrix by definition the square matrix has to have d by d matrix if x and mean has d dimension as you said . I assume you said 5 parameters in total, because symmetric terms are equal in covariance matrix, so 4-1=3 parameters coming from that Sigma matrix with size d x d .
Too many mistakes in the slides. But otherwise good explanation.
the video is great but your audio sucks. buy an adequate microphone
I can understand everything he's saying just fine.