Part 62 - Dashboard, Graphs and Charts in SpringBoot with Chart.js

Вставка
- Опубліковано 23 вер 2024
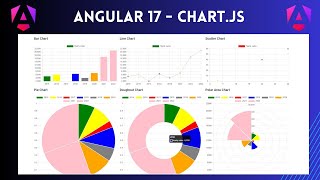
- This is part 62 of our complete application in Spring Boot. In this part, we will begin implementation of dynamic graphs and charts dashboard reports using custom-chart.js.
Find step by step procedures here:
👉 www.kindsonthe...
Complete Tutorial Series for FleetMS version 2 -
• Part 0 - Introduction ...
You can find much resources from my websites
www.kindsontheg...
www.datarmatics...
www.munonye.com
Learn Programming by joining International Computer Programmers Group:
👉 / inter. .
You can reach me via any of the following
❤️ Instagram: / kindsonthegius
❤️ LinkedIn: / kindson
❤️ Pinerest: / kindsonm
❤️ Facebook: / kindsonm
❤️ Tumblr: www.tumblr.com....
❤️ Twitter: / kindsonm
Your support can help me improve my content:
✅ Buy me a coffee: www.buymeacoff...
✅ Support me on Patreon: / kindsonthegenius
The Piano Man kindsonthepian...


Wow, so good! Can you talk about charts with Multi-line and Auto-refresh? Thanks so much!
Hi! Pretty nice to see such a clear explanation, but the "step by step procedures" link in description throws 404 error. Is there different way to get these files used on tutorial? Thanks you ;)
thanks kindson ! i have learnt a lot from u . keep it up!!
Is there a way to make the menu on the left be the icons and when clicking on any of them show the whole section? any method to make menus like that?
this is really good thank you ! can you do a dashboard using chartjs in angular 10
where is the source code bru
can u post the video in thymeleaf
te amo